An Introduction To Breakout Trading

Welcome to our guide on breakout trading, a strategy that active investors use to capitalize on early trend movements in the market. By identifying breakout opportunities when an asset’s price surpasses a resistance level or drops below a support level with increased volume, breakout traders aim to catch the beginning of significant price moves and increased volatility. With proper management, breakout trading can offer limited downside risk, making it an enticing strategy for traders seeking profit opportunities.
Key Takeaways:
- Breakout trading involves capitalizing on early trend movements by identifying breakout opportunities.
- The strategy is based on prices breaking above resistance or below support levels with increased volume.
- Proper management is essential for mitigating risk and maximizing profit potential in breakout trades.
- Breakouts can occur in various market environments and are often associated with chart patterns like triangles, flags, and head and shoulders.
- Traders should carefully plan their entry and exit points, use technical analysis tools for confirmation, and establish risk management strategies.
Understanding Breakouts
Breakout trading is a popular strategy used by active investors to take advantage of early trend movements. To effectively implement this strategy, it is essential to understand how breakouts occur and the patterns associated with them.
A breakout happens when an asset’s price moves beyond a defined support or resistance level, accompanied by increased volume. Breakout traders seize this opportunity by entering long positions when the price breaks above resistance or short positions when the price breaks below support. These breakouts often lead to increased volatility and trending price movements.
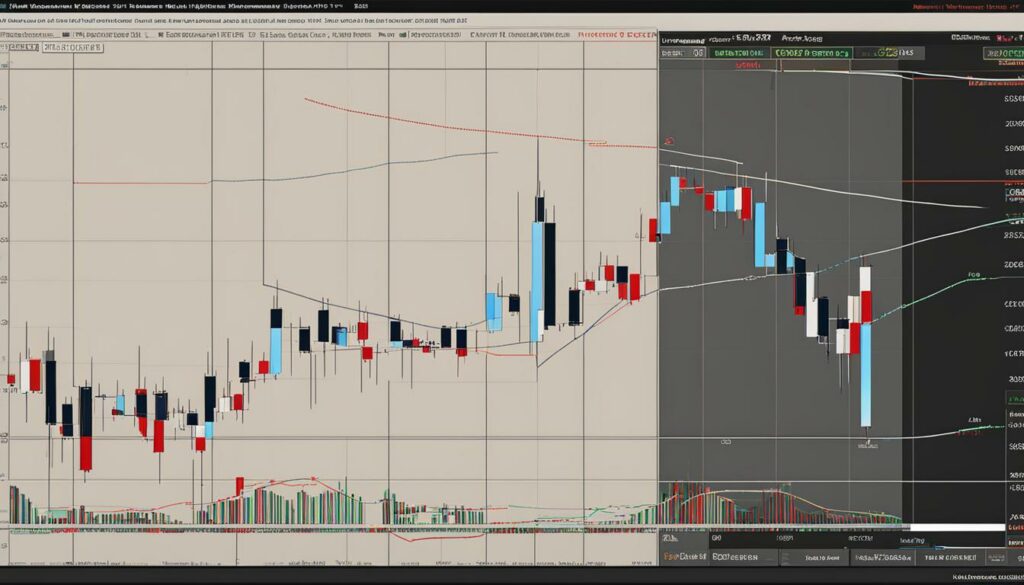
Various market environments can give rise to breakouts, and they are often associated with chart patterns such as triangles, flags, or head and shoulders patterns. These patterns reflect a temporary pause in price movement before a breakout occurs. They serve as valuable tools for traders in identifying potential breakout candidates and planning their trading strategies.
Identifying Breakout Patterns
| Pattern | Description |
|---|---|
| Triangles | These patterns form when the price consolidates, creating converging trendlines. Breakouts are often seen when the price breaks above or below the triangle formation. |
| Flags | Flags are short-term continuation patterns that occur after a sharp price movement. Breakouts typically happen when the price breaks above or below the flag pattern. |
| Head and Shoulders | This pattern consists of three peaks, with the middle peak (the head) being the highest. A breakout occurs when the price breaks below the neckline, signaling a potential reversal. |
Understanding breakout patterns and their associated chart formations is crucial for successful breakout trading. By recognizing these patterns and their breakout points, traders can effectively identify potential trading opportunities and develop strategies that align with market trends.
Key Steps in Breakout Trading
Breakout trading is a popular strategy that involves identifying and capitalizing on price movements when an asset’s price breaks above a resistance level or below a support level. To successfully execute breakout trades, there are key steps that traders should follow:
Step 1: Identify Current Price Trends
Before entering a breakout trade, it is crucial to identify the current price trend. This can be done through technical analysis, which involves analyzing historical price data and chart patterns. By understanding the direction of the trend, traders can align their breakout trades with the overall market sentiment.
Step 2: Determine Support and Resistance Levels
Support and resistance levels play a vital role in breakout trading. Traders should identify these levels as they indicate areas where buying or selling pressure is expected to be significant. Support levels are price levels where buying pressure is expected to outweigh selling pressure, while resistance levels are price levels where selling pressure is expected to outweigh buying pressure. These levels act as barriers that the price must break through for a successful breakout trade.
Step 3: Plan Entry and Exit Points
Once the current price trend and support and resistance levels are identified, traders should plan their entry and exit points. When entering a breakout trade, traders typically wait for the price to close above a resistance level for long positions or below a support level for short positions. This confirmation helps differentiate between a breakout and a fakeout. Traders should also set profit targets based on recent price behavior and establish stop-loss orders to limit potential losses if the breakout fails.
By following these key steps, breakout traders can increase their chances of success. It is important to note that breakout trading requires discipline, patience, and adherence to risk management principles. Traders should also be aware of the potential risks and drawbacks of breakout trading, such as false breakouts and increased volatility. With proper analysis and execution, breakout trading can be a profitable strategy in the financial markets.
Finding Good Breakout Candidates
When it comes to breakout trading, the key to success lies in finding good breakout candidates. These are stocks or assets that have strong potential for significant price movements and offer favorable trading opportunities. To identify these candidates, traders should consider several factors, including support and resistance levels, price patterns, and the consistency of the stock’s adherence to these levels over time.
Support and resistance levels are essential tools for breakout traders. Support levels are price levels at which the asset has historically had difficulty falling below, while resistance levels are price levels at which the asset has had difficulty surpassing. The stronger and more tested these levels are, the better the chances of a successful breakout when the price eventually breaks out.
Price patterns can also provide valuable insights for identifying good breakout candidates. Patterns such as channels, triangles, and flags can indicate potential breakouts when the price breaks above or below the pattern boundaries. These patterns can help traders anticipate the direction and magnitude of the breakout, allowing for more informed trading decisions.
| Factors to Consider for Finding Good Breakout Candidates |
|---|
| Support and resistance levels |
| Price patterns |
| Consistency of adherence to support and resistance levels |
Consistency is another crucial factor when identifying good breakout candidates. Traders should look for stocks that consistently adhere to their support and resistance levels over time. This indicates a strong level of market interest and participation, increasing the likelihood of a breakout when the price eventually surpasses these levels.
By considering these factors and conducting thorough technical analysis, breakout traders can identify good candidates for trading breakouts. This allows them to focus their efforts on assets with the highest potential for significant price movements, increasing their chances of profitable trades.

Example Breakout Candidate
“Stock XYZ has shown consistent adherence to a strong resistance level over the past six months. It has tested this level multiple times without breaking out. The increasing volume during each test suggests growing market interest and potential for a significant breakout. Additionally, the stock has formed a bullish triangle pattern, indicating a possible upward breakout in the near future. Based on these factors, we believe that Stock XYZ is a strong breakout candidate worth considering for potential trades.”
Entry Points in Breakout Trading
When it comes to breakout trading, timing is crucial. The entry points determine the success of a breakout trade. To effectively enter a breakout trade, traders should wait for a clear indication that the breakout is valid. This is often confirmed by the price closing above a resistance level for long positions or below a support level for short positions. This confirmation helps distinguish between a breakout and a fakeout, ensuring that traders enter the trade at the right time.
Some traders also consider above-average volume as confirmation of a valid breakout. Increased volume indicates strong market participation and supports the potential for a significant price move. Traders may also choose to wait until the close of a trading period, such as the end of the day or the completion of a candlestick pattern, to determine if prices will sustain the breakout levels.
Factors to Consider When Identifying Entry Points:
- Resistance Level: A clear and well-defined resistance level can act as a barrier that needs to be broken for an asset’s price to continue rising.
- Support Level: Similarly, a support level serves as a level that the price needs to break below for a downtrend to continue.
- Confirmation: Waiting for confirmation, such as a price close above resistance or below support, helps ensure a valid breakout.
- Above-Average Volume: Increased volume can provide additional confirmation of a breakout and indicate strong market participation.
- Time of Entry: Some traders prefer to wait until the close of a trading period to ensure that prices will sustain the breakout levels.
By considering these factors and waiting for confirmation, traders can improve their chances of entering successful breakout trades and avoid false breakouts.
Planning Exits in Breakout Trading
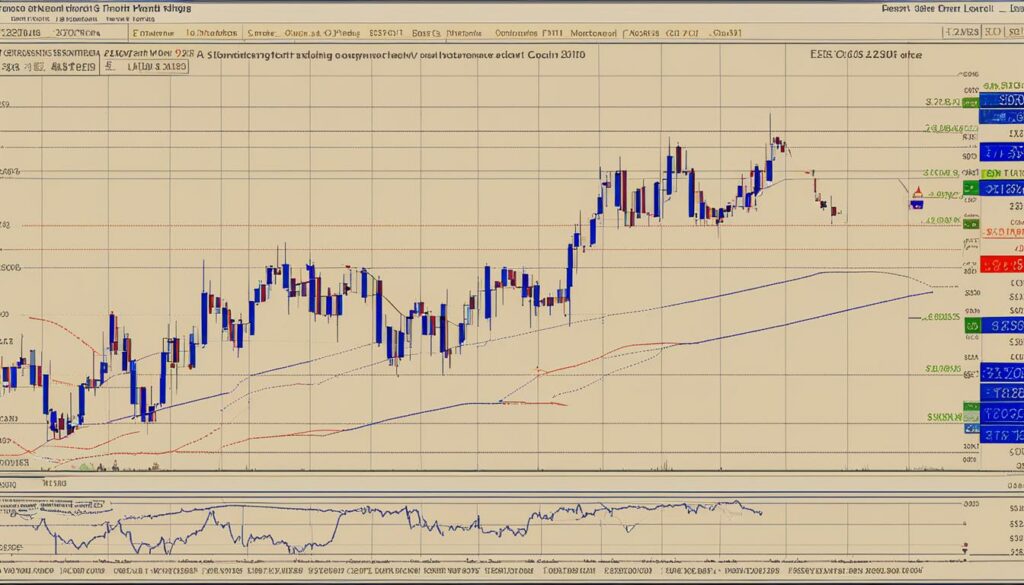
Planning exits is a crucial aspect of breakout trading. It involves establishing target prices and having a clear exit strategy to protect profits and limit losses. Here, we will discuss the key elements of planning exits in breakout trading.
Exit Strategy:
When trading breakouts, it is essential to have a well-defined exit strategy. This strategy should include specific price targets based on recent price behavior, price patterns, or average price swings. Identifying these targets can help traders capture profits and avoid holding positions for too long, potentially missing out on additional opportunities.
Stop-Loss Orders:
Setting stop-loss orders is an important risk management technique in breakout trading. A stop-loss order is an instruction placed with a broker to automatically sell a security if it reaches a predetermined price level. In breakout trading, stop-loss orders are typically set below support levels for long trades and above resistance levels for short trades. This helps limit potential losses and protects traders from significant downside risks.
Monitoring Price Action:
Continuously monitoring price action is essential when planning exits in breakout trading. Traders should pay attention to how the price reacts after a breakout and adjust their exit strategy accordingly. If the price quickly retraces or fails to sustain the breakout levels, it may be a signal to exit the trade. On the other hand, if the price continues to move strongly in the desired direction, traders may consider adjusting their profit targets or trailing stop-loss orders to maximize gains.
By planning exits and incorporating stop-loss orders into their breakout trading strategy, traders can effectively manage risk and increase the likelihood of profitable trades. It is important to stay disciplined and adhere to the predetermined exit strategy, even if emotions or market conditions tempt otherwise.

Example Table: Exit Strategy Targets
| Stock | Entry Price | Target Price | Stop-Loss Price |
|---|---|---|---|
| ABC | $50 | $60 | $45 |
| XYZ | $75 | $90 | $70 |
| DEF | $100 | $120 | $95 |
In this table, we present an example of an exit strategy for three hypothetical stocks. Each stock has an entry price, a target price, and a stop-loss price. Traders can use this type of table to track their planned exit levels for different trades, allowing for easier decision-making and trade management.
Best Indicators for Breakout Trading
When it comes to breakout trading, technical analysis is a valuable tool for identifying potential opportunities. While breakout strategies can be based solely on price action, incorporating indicators can provide additional support and entry signals. In this section, we will explore some of the best indicators for breakout trading.
Ichimoku Cloud
The Ichimoku Cloud is a popular indicator that can be used to identify breakouts. It consists of several components, including the cloud (also known as the Kumo), the Tenkan-sen (Conversion Line), and the Kijun-sen (Base Line). When the price moves above or below the cloud, it can signal a breakout. Traders can use this indicator to confirm the strength of a breakout and potentially enter a trade.
Relative Strength Index (RSI)
The Relative Strength Index (RSI) is another widely used indicator in breakout trading. It measures the strength and momentum of price movements and can help traders identify overbought or oversold conditions. When the RSI crosses certain thresholds, it can indicate a potential breakout. Traders can use this indicator in combination with other technical analysis tools to confirm breakouts and make informed trading decisions.
It’s important to note that while these indicators can be valuable in breakout trading, they should not be used in isolation. Traders should always consider multiple factors, such as support and resistance levels, price patterns, and overall market conditions, to increase the probability of successful breakout trades.
Pros and Cons of Breakout Trading
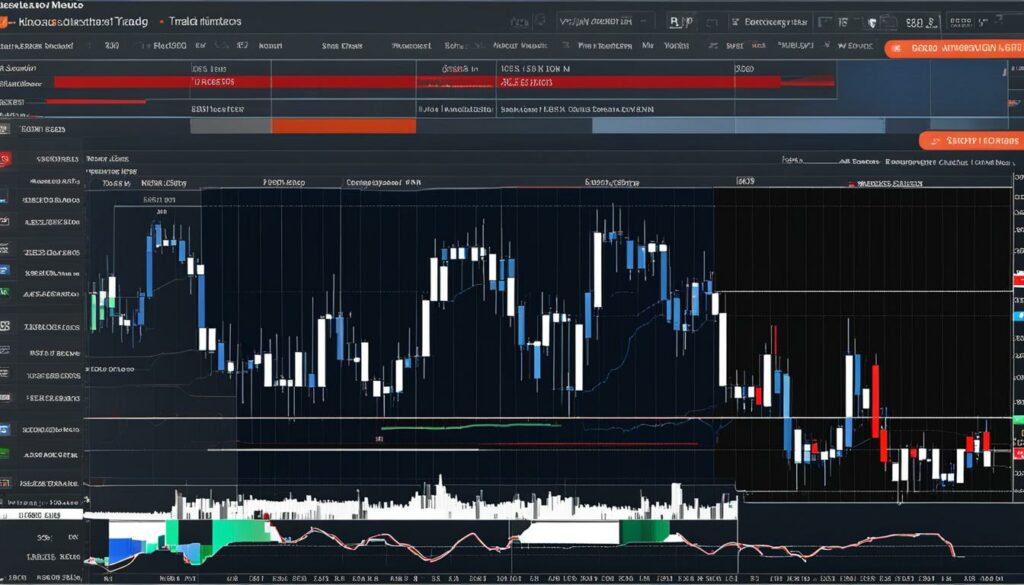
Breakout trading, like any other trading strategy, has its own set of advantages and disadvantages. Understanding these pros and cons can help traders make informed decisions and develop effective risk management strategies. Let’s take a closer look at the benefits and drawbacks of breakout trading.
Pros of Breakout Trading
- Profit Potential: Breakouts can lead to significant price movements, offering the potential for substantial profits. By identifying and trading breakouts early, traders can capture these momentum-driven moves and maximize their returns.
- Clear Entry and Exit Signals: Breakout trading provides clear entry and exit signals. Traders can enter long positions when the price breaks above resistance or short positions when the price breaks below support. This straightforward approach simplifies decision-making and helps traders execute their trades with confidence.
- Defined Risk: Proper risk management is essential in breakout trading. Traders can set stop-loss orders below support levels for long trades and above resistance levels for short trades. This allows them to limit their potential losses and protect their capital, even if the breakout fails.
Cons of Breakout Trading
- False Breakouts: One of the main challenges in breakout trading is the occurrence of false breakouts. Sometimes, a price may briefly break through a support or resistance level, only to reverse and return to its previous range. This can result in losses for traders who entered the breakout prematurely.
- Risk of Missing Big Moves: While breakout trading offers the potential to catch significant price moves, there is always a risk of missing out on big moves. Setting strict entry criteria and waiting for confirmation can reduce the risk of false breakouts but may also mean missing some profitable opportunities.
- Psychological Factors: Breakout trading requires discipline and emotional control. Traders need to stick to their trading plan, cut losses, and let winners run. Emotions like fear and greed can negatively impact decision-making and lead to impulsive actions.
In conclusion, breakout trading can be a profitable strategy if executed with proper risk management. The potential for capturing significant price moves, clear entry and exit signals, and defined risk make breakout trading attractive to many traders. However, traders must be mindful of the risks associated with false breakouts, missing big moves, and the psychological factors involved. By carefully considering these pros and cons, traders can enhance their breakout trading strategies and improve their overall trading performance.

Time Frames for Breakout Trading
When it comes to breakout trading, the choice of time frame can greatly impact a trader’s strategy and potential for success. Different time frames offer unique advantages and considerations, allowing traders to customize their approach to fit their trading style and goals.
1. Intraday Trading: Short-term traders often prefer lower time frames, such as 5-minute or 15-minute charts, for breakout trading. These shorter time frames allow traders to capture quick market moves and take advantage of intraday volatility. Intraday breakout trades require close monitoring and quick decision-making.
2. Swing Trading: Swing traders typically focus on time frames ranging from a few hours to several days. These traders aim to catch larger price moves by identifying breakouts from key support or resistance levels. Swing trading breakout strategies require patience and the ability to hold positions for longer periods.
3. Position Trading: Position traders take a longer-term approach, holding trades for weeks or even months. Breakout trading on higher time frames, such as daily or weekly charts, allows position traders to ride the momentum of significant price movements. Position trading requires a broader perspective and the ability to withstand market fluctuations.
“The choice of time frame in breakout trading is crucial. Short-term traders can exploit quick market movements, while long-term traders have the potential to capture significant trends.”
Each time frame offers its own set of advantages and challenges. The key is to align your breakout trading strategy with your trading goals, risk tolerance, and available time for active monitoring. It’s important to note that regardless of the time frame chosen, proper risk management and adherence to your trading plan are essential for success.
Table: Comparison of Time Frames for Breakout Trading
| Time Frame | Advantages | Considerations |
|---|---|---|
| Intraday Trading | – Ability to capture quick market moves – Take advantage of intraday volatility |
– Requires close monitoring – Quick decision-making |
| Swing Trading | – Potential for larger price moves – Breakouts from key support/resistance levels |
– Requires patience – Holding positions for longer periods |
| Position Trading | – Capture significant trends – Less need for active monitoring |
– Longer time frame – Greater exposure to market fluctuations |
Conclusion
Breakout trading is a powerful and profitable trading strategy that allows us to take advantage of strong directional moves in the market. By following the key steps outlined in this article, identifying good breakout candidates, and planning our entry and exit points, we can effectively trade breakouts and increase our chances of success.
However, it is important to remember that breakout trading also comes with risks. Proper risk management is crucial to protect our capital and avoid unnecessary losses. Setting stop-loss orders and having predetermined exit levels for both profits and losses are essential elements of a successful breakout trading strategy.
While breakout trading can be a profitable strategy, it is important to be aware of the potential drawbacks. False breakouts can occur, leading to losses if we enter trades prematurely. Adding confirmation signals and using indicators can help reduce the risk of false breakouts, but it may also decrease our chances of catching big moves.
In conclusion, breakout trading, when executed with proper risk management, can be a profitable trading strategy. By understanding the key steps, identifying good breakout candidates, and planning our entry and exit points, we can maximize our trading opportunities and navigate the markets with confidence.
FAQ
What is breakout trading?
Breakout trading is a strategy used by active investors to take advantage of price movements in the early stages of a trend. It involves identifying breakout opportunities when an asset’s price moves above a resistance level or below a support level on increasing volume.
How do breakout traders enter positions?
Breakout traders enter long positions when the price breaks above resistance or short positions when the price breaks below support.
What types of market environments are breakout trades associated with?
Breakouts can occur in various market environments and are often associated with chart patterns such as triangles, flags, or head and shoulders patterns.
What are the key steps in breakout trading?
The key steps in breakout trading include identifying current price trends, support and resistance levels, and planning entry and exit points.
How can traders find good breakout candidates?
Traders should consider the underlying stock’s support and resistance levels, the strength of these levels, price patterns, consistency, and the length of time a stock price adheres to its support or resistance levels.
When should traders enter a breakout trade?
It is important to wait for the price to close above a resistance level for long positions or below a support level for short positions. Some traders also look for above-average volume as confirmation.
How can traders plan exits in breakout trading?
Traders should establish target prices based on recent price behavior, price patterns, or average price swings. Stop-loss orders should be set below support levels for long trades and above resistance levels for short trades.
What are some popular indicators for breakout trading?
Some popular indicators for breakout trading include the Ichimoku Cloud and RSI (Relative Strength Index).
What are the pros and cons of breakout trading?
Breakout trading offers the potential for quick market moves and has a straightforward entry and exit strategy. However, there is a higher chance of false breakouts, so risk management becomes crucial.
Can breakout trading be applied to different time frames?
Yes, breakout trading can be applied to various time frames, from intraday to longer-term charts.
