Chart Patterns: What They Are & How Traders Use Them

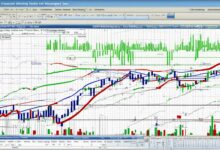
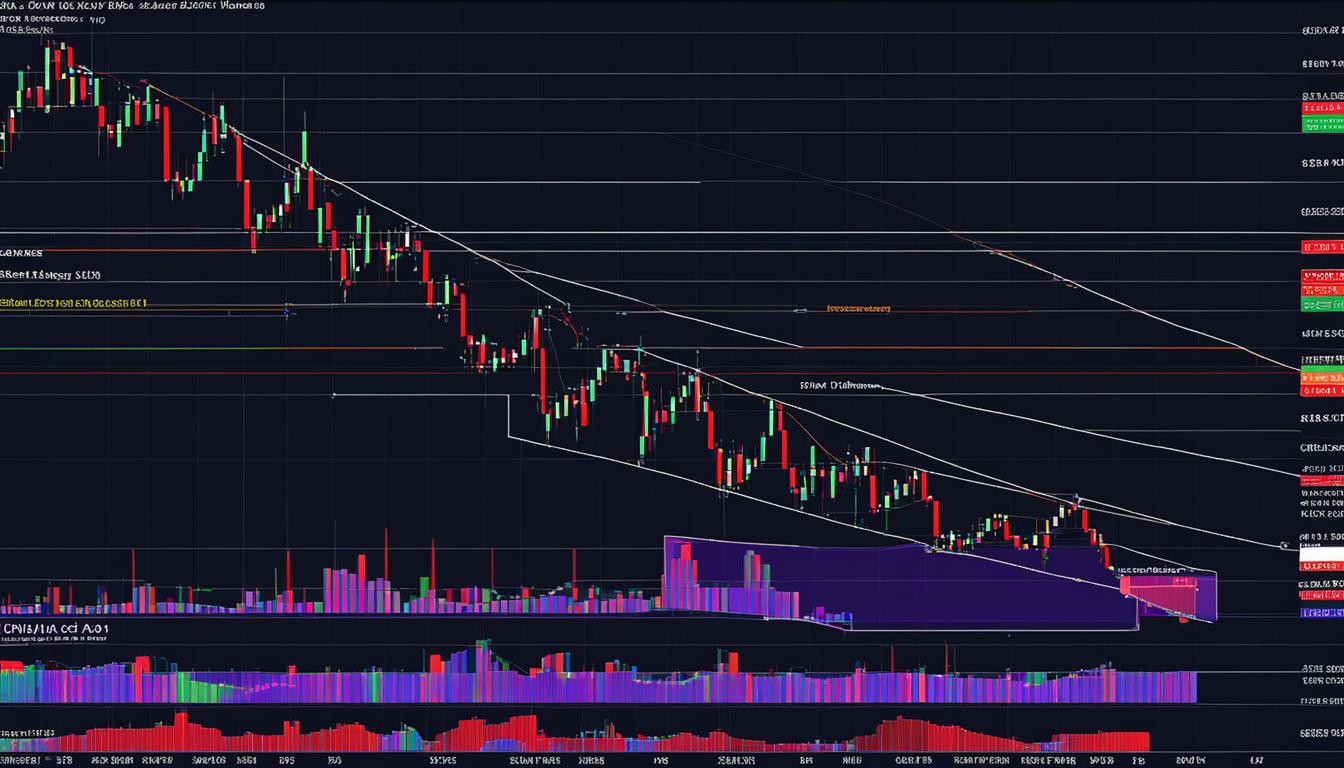
Chart patterns play a crucial role in technical analysis, helping traders predict market movements and make informed trading decisions. By analyzing past price movements, chart patterns provide valuable insights into potential trend reversals, continuation patterns, and areas of support and resistance. In this article, we will explore the different types of chart patterns and how traders use them to navigate the stock market and other financial markets.
Before delving into the intricacies of chart patterns, it is important to understand what they are. A chart pattern is a recognizable shape that forms within a price chart, reflecting the collective actions of buyers and sellers. These patterns can range from simple formations to complex structures, each with its own significance and implications.
Traders use chart patterns as a visual representation of market sentiment and behavior. By identifying and interpreting these patterns, traders can anticipate potential price movements and adjust their trading strategies accordingly. Whether you are a day trader, swing trader, forex trader, or cryptocurrency trader, understanding chart patterns is essential for success in the markets.
Key Takeaways:
- Chart patterns provide valuable insights into potential trend reversals, continuation patterns, and areas of support and resistance.
- They reflect the collective actions of buyers and sellers in the market.
- Traders use chart patterns to anticipate potential price movements and adjust their trading strategies accordingly.
- Understanding chart patterns is essential for success in the stock market and other financial markets.
- Chart patterns should be used in conjunction with other analysis techniques for optimal results.
Understanding Support and Resistance Levels in Chart Patterns
In chart pattern analysis, support and resistance levels play a crucial role in understanding the behavior of the price action. These levels provide valuable insights into the balance between buyers and sellers in the market and help traders identify potential areas of price reversals or trend continuations.
Support levels refer to the price level at which an asset’s downward movement is halted and the price bounces back up. It is the point where demand outweighs supply, causing the price to find stability. Traders often view support levels as opportunities to buy or enter long positions, expecting the price to reverse its downward trend.
Resistance levels, on the other hand, represent the price level at which an asset’s upward movement is halted and the price dips back down. It is the point where supply outweighs demand, causing the price to encounter selling pressure. Traders often view resistance levels as opportunities to sell or enter short positions, anticipating the price to reverse its upward trend.
Support and resistance levels are typically identified through technical analysis techniques such as trendlines, horizontal levels, or moving averages. By analyzing the historical price movements and identifying these key levels, traders can make more informed decisions about potential entry and exit points. Additionally, support and resistance levels can be used alongside other chart patterns and indicators to validate trading signals and enhance the overall effectiveness of a trading strategy.
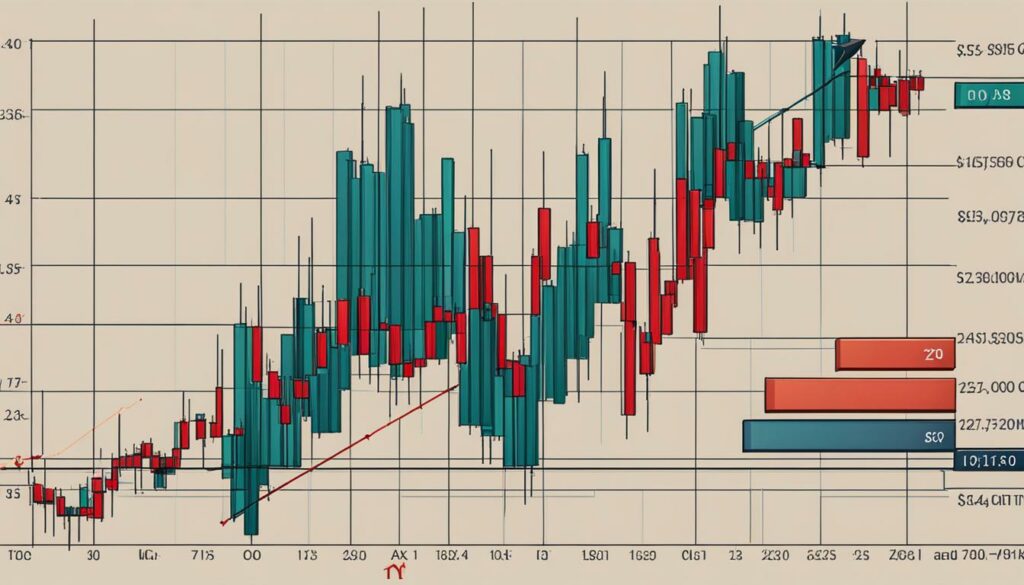
Example of Support and Resistance Levels in a Chart Pattern
“The support level at $50 was tested multiple times, but each time the price bounced back up, indicating strong buying interest. On the other hand, the resistance level at $60 prevented the price from breaking higher, showing selling pressure. These support and resistance levels played a significant role in shaping the subsequent price movements.”
Understanding support and resistance levels in chart patterns is essential for traders looking to capitalize on price movements. By recognizing these levels, traders can make more informed decisions, manage risk effectively, and enhance their overall trading strategies.
| Support and Resistance Levels | Description |
|---|---|
| Support | The price level at which an asset’s downward movement is halted and bounces back up. |
| Resistance | The price level at which an asset’s upward movement is halted and dips back down. |
Reversal Chart Patterns
Reversal chart patterns play a crucial role in technical analysis, indicating potential trend reversals. These patterns can provide valuable insights to traders looking to capitalize on bearish or bullish reversals in the market. Some commonly observed reversal patterns include head and shoulders, double tops and bottoms, and rounding bottom.
In an uptrend, the head and shoulders pattern signals a bearish reversal. It consists of three peaks, with the middle peak (the head) being higher than the other two (the shoulders). This pattern suggests that buyers are losing control, and a reversal to a bearish trend may be imminent. Conversely, in a downtrend, the head and shoulders pattern can indicate a bullish reversal, with the potential for a new uptrend to form.
Double tops and double bottoms are reversal patterns that occur when the price reaches a resistance or support level twice before reversing. A double top is formed when the price reaches a peak and then retraces, failing to break above the previous high. This pattern suggests that sellers are gaining control and a bearish reversal may occur. On the other hand, a double bottom occurs when the price reaches a low and then bounces back, failing to break below the previous low. This pattern indicates that buyers are gaining control and a bullish reversal may be on the horizon.
| Reversal Pattern | In Uptrend | In Downtrend |
|---|---|---|
| Head and Shoulders | Bearish Reversal | Bullish Reversal |
| Double Tops | Bearish Reversal | N/A |
| Double Bottoms | N/A | Bullish Reversal |
Rounding bottom, also known as a saucer pattern, is a reversal pattern that appears as a rounded, U-shaped formation. This pattern suggests that a downtrend is nearing its end and a new uptrend may emerge. It indicates a gradual shift from selling pressure to buying pressure in the market.
Understanding and recognizing these reversal chart patterns can provide traders with valuable insights into potential trend reversals. It is important to note that chart patterns should not be relied upon as the sole basis for trading decisions. They should be used in conjunction with other technical analysis tools and indicators to validate trading signals.
Continuation Chart Patterns
In technical analysis, continuation chart patterns are an essential tool for traders looking to capitalize on temporary pauses in the prevailing trend. These patterns provide valuable insights into the potential direction and strength of the ongoing trend, allowing traders to make informed trading decisions. One popular type of continuation pattern is the pennant.
Pennant
The pennant is a continuation pattern that typically forms after a strong price move, resembling a small symmetrical triangle. It is characterized by converging trendlines, indicating a temporary consolidation phase before the price continues its previous trend. The converging trendlines represent a decrease in volatility and trading range, suggesting that market participants are taking a breather before resuming their buying or selling activity.
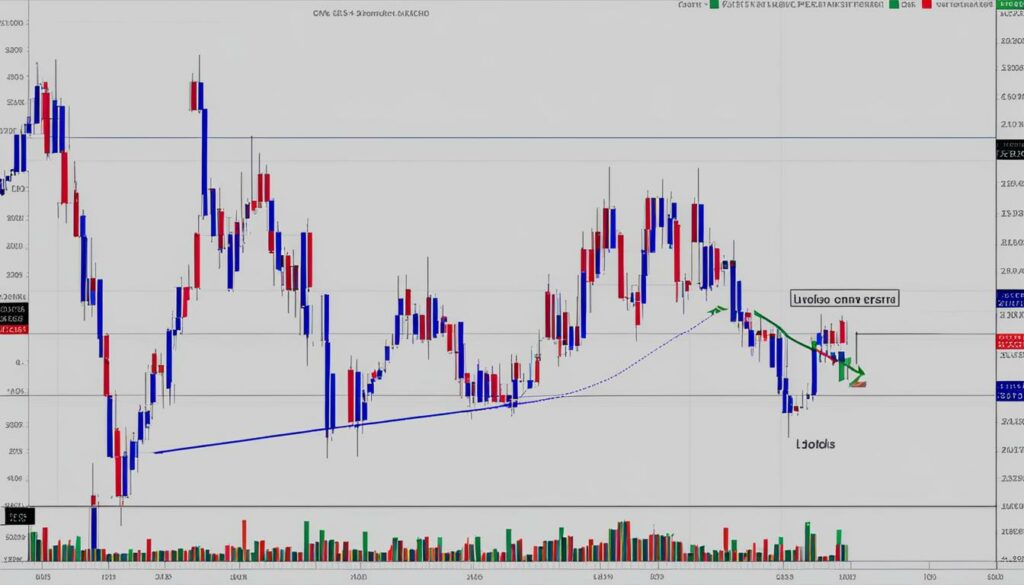
Traders often look for a breakout from the pennant pattern as a confirmation of the continuation of the trend. A bullish breakout occurs when the price breaks above the upper trendline of the pennant, while a bearish breakout happens when the price breaks below the lower trendline. The breakout is accompanied by an increase in trading volume, indicating renewed market interest and potential momentum.
Other Continuation Patterns
Aside from pennants, other continuation patterns include flags and wedges. Flags are similar to pennants but have trendlines that are parallel instead of converging. They are often seen as a brief pause in the trend before it resumes. Wedges, on the other hand, are formed by two sloping trendlines that can be either rising or falling. Rising wedges suggest a continuation of the uptrend, while falling wedges indicate a continuation of the downtrend.
Traders can use these continuation chart patterns to identify potential trading opportunities in line with the prevailing trend. By recognizing these patterns and their associated breakout signals, traders can enter or add to positions with higher probability of success.
| Continuation Pattern | Description |
|---|---|
| Pennant | A small symmetrical triangle pattern that indicates a temporary consolidation before the price continues its previous trend. |
| Flag | A pattern characterized by parallel trendlines, signaling a brief pause in the trend before it resumes. |
| Wedge | A pattern formed by two sloping trendlines that can be either rising or falling, indicating a continuation of the prevailing trend. |
Bilateral Chart Patterns
Bilateral chart patterns are an important tool in technical analysis for traders in volatile markets. These patterns, such as symmetrical triangles, indicate a period of consolidation where the price could break out in either direction. By recognizing and understanding bilateral chart patterns, traders can gain valuable insights into potential future price movements.
Symmetrical triangles are one of the most well-known bilateral chart patterns. They are characterized by a series of higher lows and lower highs, forming converging trendlines that meet at a point. This pattern suggests that the market is in a state of indecision, with buyers and sellers in equilibrium. Traders often look for a breakout above or below the trendlines to confirm a new trend direction.
“Bilateral chart patterns, like symmetrical triangles, provide traders with a valuable opportunity to capitalize on potential breakouts. By waiting for a confirmed breakout, traders can enter positions with a higher probability of success.”
In addition to symmetrical triangles, other common bilateral chart patterns include ascending triangles and descending triangles. Ascending triangles are characterized by a flat top trendline and a rising bottom trendline, indicating a potential bullish breakout. On the other hand, descending triangles have a flat bottom trendline and a falling top trendline, suggesting a potential bearish breakout. Both patterns can provide key levels for traders to monitor and trade upon a confirmed breakout.
| Chart Pattern | Description | Breakout Direction |
|---|---|---|
| Symmetrical Triangle | Converging trendlines with higher lows and lower highs | Above or below the trendlines |
| Ascending Triangle | Flat top trendline and rising bottom trendline | Above the flat top trendline |
| Descending Triangle | Flat bottom trendline and falling top trendline | Below the flat bottom trendline |
Traders should be cautious when trading bilateral chart patterns as false breakouts can occur. It is essential to wait for a confirmed breakout with strong volume and follow-through before entering a trade. Additionally, traders should consider other technical indicators and market factors to increase the likelihood of a successful trade.
Using Chart Patterns for Day, Swing, Forex, and Cryptocurrency Trading
Chart patterns are versatile tools that can be applied to various trading styles and markets. Whether you are a day trader, swing trader, or interested in trading forex or cryptocurrencies, chart patterns can help you identify potential trading opportunities and make informed decisions.
For day traders, shorter timeframes are often used to analyze intraday chart patterns. These patterns can provide valuable insights into short-term price movements and help traders capture quick profits. By identifying support and resistance levels, breakouts, and reversal patterns, day traders can make timely trades based on chart pattern analysis.
Swing traders, on the other hand, focus on longer-term chart patterns to capture multi-day or multi-week trends. By analyzing continuation patterns, such as pennants and flags, or reversal patterns like head and shoulders, swing traders can enter trades with the goal of capturing larger price movements. A combination of chart pattern analysis and trend identification can be a powerful strategy for swing traders.
Forex and cryptocurrency traders can also benefit from using chart patterns in their analysis. These markets often exhibit unique price patterns, and chart pattern analysis can help identify potential trading opportunities. Whether it’s identifying triangle patterns, double tops or bottoms, or trendline breakouts, chart patterns can provide valuable insights into the direction of these markets and guide traders’ decisions.
Table: Common Chart Patterns for Different Trading Styles
| Trading Style | Chart Patterns |
|---|---|
| Day Trading |
|
| Swing Trading |
|
| Forex Trading |
|
| Cryptocurrency Trading |
|
As with any trading strategy, it’s important to remember that chart patterns are not foolproof and should be used in conjunction with other technical analysis tools. Additionally, risk management and proper trade execution are crucial for successful trading. By combining chart pattern analysis with other indicators and strategies, traders can increase their chances of success in the market.
How to Trade Chart Patterns
Trading chart patterns requires the application of various strategies to capitalize on market opportunities. Two common strategies used by traders are breakout patterns and reversal patterns. Breakout patterns occur when the price breaks above or below a specific level of support or resistance, indicating a potential trend continuation or reversal. Traders can enter positions when the breakout occurs to ride the momentum and potentially profit from the price movement. Reversal patterns, on the other hand, suggest that the prevailing trend is about to change direction. Traders can take advantage of reversal patterns by entering positions in the opposite direction of the trend, aiming to profit from the upcoming trend reversal.
Support and resistance levels play a crucial role in trading chart patterns. These levels are identified based on previous price movements and represent areas where the price is likely to encounter obstacles or reverse its direction. Traders often use support and resistance levels as reference points for setting stop-loss and take-profit orders. By placing stop-loss orders below support levels or above resistance levels, traders aim to limit their potential losses if the price fails to move in the desired direction. Take-profit orders, on the other hand, are placed near support or resistance levels to secure profits once the price reaches those levels.
It is important to note that trading chart patterns should not be solely relied upon. While patterns can provide valuable insights into market trends and potential price movements, they should be used in conjunction with other technical analysis tools and indicators. Traders should consider factors such as market conditions, news events, and overall market sentiment to make informed trading decisions. Additionally, proper risk management techniques should be employed to protect capital and manage potential losses. This includes using appropriate position sizing, setting stop-loss orders, and diversifying trading portfolios.
Example Breakout Pattern Trading Strategy
- Identify a consolidation phase where the price is confined within a range.
- Wait for the price to break above the upper resistance level or below the lower support level.
- Enter a long position if the breakout occurs above resistance or a short position if the breakout occurs below support.
- Place a stop-loss order below the breakout level for long positions or above the breakout level for short positions.
- Set a take-profit order at a predetermined price target or trail the stop-loss order to lock in profits as the price moves in favor.
- Monitor the trade and adjust stop-loss and take-profit levels if necessary.
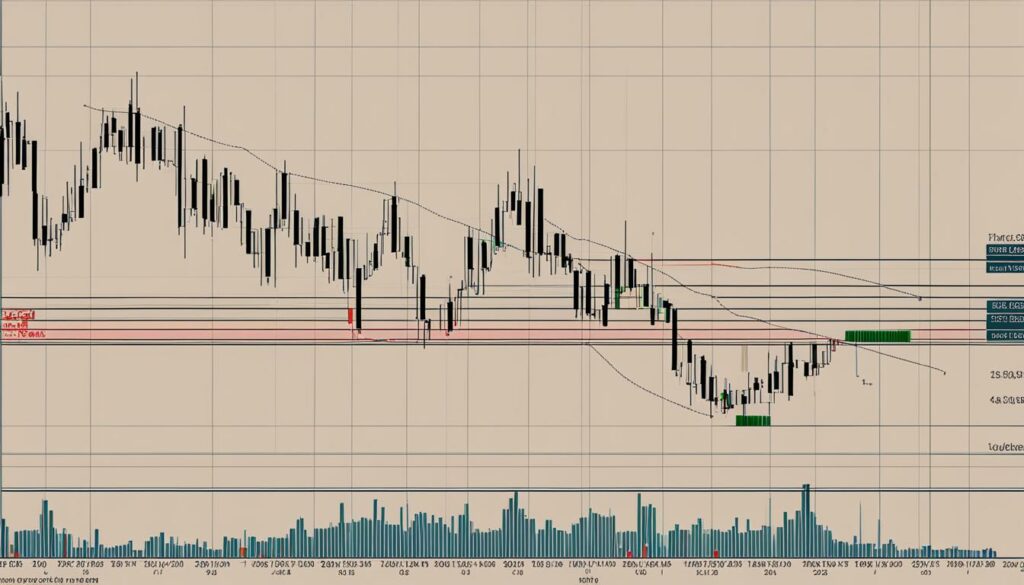
Remember, trading chart patterns requires practice and experience. It is important to develop a solid understanding of various patterns, their reliability, and the specific market you are trading. By combining chart patterns with other forms of technical analysis and applying sound risk management, traders can increase their chances of success in the market.
Trend Analysis and Price Action in Chart Patterns
Trend analysis and price action are crucial components of chart pattern analysis. Traders rely on these techniques to evaluate the direction and strength of trends, providing valuable insights into potential pattern formations and market sentiment. Understanding how to interpret trend analysis and price action can greatly enhance the accuracy of chart pattern analysis and improve trading decisions.
Trend analysis involves examining the overall direction of price movements over a specific period. Traders aim to identify whether the market is trending upwards, downwards, or experiencing a sideways consolidation. By analyzing trends, traders can determine whether a chart pattern is forming in line with the prevailing market direction or if it signals a potential trend reversal.
Price action refers to the movement of the price itself and the patterns it creates on the chart. Traders analyze key levels, such as support and resistance, to identify areas where price reversals or breakouts are likely to occur. By studying price action, traders can spot patterns, such as ascending or descending triangles, that provide valuable insights into future price movements.
Benefits of Trend Analysis and Price Action
Trend analysis and price action offer several benefits for traders utilizing chart patterns. Firstly, they help identify the strength and sustainability of trends, allowing traders to ride the momentum and capture profitable trades. Additionally, trend analysis and price action provide valuable confirmation signals for chart patterns, increasing the probability of successful trades.
By combining trend analysis and price action with chart patterns, traders can develop a holistic understanding of market dynamics and make informed trading decisions. It is important to note that trend analysis and price action are not foolproof indicators, and traders should always use them in conjunction with other technical analysis tools for comprehensive market analysis.
| Trend Analysis and Price Action in Chart Patterns | Benefits |
|---|---|
| Identify the direction and strength of trends | Helps traders ride the momentum and capture profitable trades |
| Confirm chart pattern formations | Increases the probability of successful trades |
| Provide insights into market dynamics | Enhances overall trading decisions |
In conclusion, trend analysis and price action are fundamental tools in chart pattern analysis. Traders who can effectively interpret and apply these techniques have a greater chance of identifying profitable trading opportunities and making informed decisions. When combined with chart patterns, trend analysis and price action provide a comprehensive understanding of market trends and dynamics, ultimately improving trading outcomes.
Common Mistakes to Avoid in Chart Pattern Trading
When it comes to chart pattern trading, avoiding common mistakes is crucial for success in the stock market. While chart patterns can provide valuable insights into potential market movements, it is important to remember that they are not foolproof indicators and should be used in conjunction with other technical analysis tools. Here are some common mistakes to avoid:
- Relying solely on chart patterns: It is essential to consider other factors such as market trends, fundamental analysis, and economic indicators when making trading decisions. Chart patterns should be used as one piece of the puzzle rather than the sole basis for trading.
- Overtrading: Trading too frequently can lead to poor decision-making and increased transaction costs. It is important to exercise patience and wait for high-quality chart pattern setups before entering or exiting trades.
- Ignoring proper risk management: Failing to use proper risk management techniques can result in significant losses. Traders should determine their risk tolerance, set stop-loss orders, and adhere to position sizing rules to protect their capital.
“Chart patterns are valuable tools, but they should never be used in isolation. They need to be combined with other technical analysis tools and indicators to form a comprehensive trading strategy.” – John Smith, Senior Trader
Lastly, it is important to recognize that chart patterns are not infallible and can result in false signals. While they can provide insights into potential market movements, traders should always exercise caution and consider the broader market context before making trading decisions.

Table: Common Mistakes to Avoid in Chart Pattern Trading
| Mistake | Description |
|---|---|
| Relying solely on chart patterns | Using chart patterns as the sole basis for trading decisions, without considering other factors such as market trends and fundamental analysis. |
| Overtrading | Engaging in excessive trading, leading to poor decision-making and increased transaction costs. |
| Ignoring proper risk management | Failure to implement risk management techniques, such as setting stop-loss orders and adhering to position sizing rules. |
By avoiding these common mistakes and adopting a comprehensive approach to chart pattern trading, traders can increase their chances of success in the stock market.
Conclusion
In conclusion, chart patterns are powerful tools for traders in analyzing the stock market and other financial markets. They provide valuable insights into potential trend reversals, continuation patterns, and areas of support and resistance. By understanding and identifying these patterns, traders can make informed decisions and improve their trading strategies.
It is important to note, however, that chart patterns should not be relied upon as the sole indicator for trading decisions. They should be used in conjunction with other technical analysis tools and factors, such as market conditions, economic news, and overall market trends. This holistic approach can further enhance the accuracy and effectiveness of chart pattern analysis.
Moreover, it is crucial for traders to practice proper risk management techniques and avoid common mistakes. Overtrading, solely relying on chart patterns without considering other factors, and failure to use proper stop-loss and take-profit levels are common pitfalls that traders should be mindful of. By being aware of these potential pitfalls, traders can mitigate risks and improve their overall trading performance.
In summary, chart patterns offer valuable insights into market movements and provide traders with a framework for analyzing and predicting price actions. When used correctly, in conjunction with other analysis techniques, chart patterns can significantly enhance a trader’s decision-making process and improve their overall trading success.
FAQ
What are chart patterns?
Chart patterns are shapes within a price chart that suggest what prices might do next based on past price movements. Traders use these patterns to predict market movements and make trading decisions.
What are support and resistance levels?
Support refers to the level at which an asset’s price stops falling and bounces back up, while resistance is where the price usually stops rising and dips back down. These levels are formed by the balance between buyers and sellers in the market.
What are reversal chart patterns?
Reversal chart patterns indicate that the ongoing trend is about to change direction. Examples include head and shoulders, double tops and bottoms, and rounding bottom.
What are continuation chart patterns?
Continuation chart patterns signal a temporary pause in the prevailing trend before it continues. Examples include pennants, flags, and wedges.
What are bilateral chart patterns?
Bilateral chart patterns, such as symmetrical triangles, indicate that the price could move either way. These patterns are best used in volatile markets where there is no clear indication of the price’s direction.
How can chart patterns be applied to trading?
Chart patterns can be applied to various trading styles and markets. Day traders can use shorter timeframes to identify and capitalize on intraday chart patterns. Swing traders can take advantage of longer-term chart patterns to capture multi-day or multi-week trends. Forex and cryptocurrency traders can also apply chart patterns to identify potential trading opportunities in these markets.
How do I trade chart patterns?
Trading chart patterns involves the use of various strategies. Breakout patterns occur when the price breaks above or below a specific level of support or resistance, indicating a potential trend continuation or reversal. Reversal patterns can be traded by entering positions in the opposite direction of the prevailing trend. Traders often use support and resistance levels as stop-loss and take-profit levels.
What is trend analysis and price action in chart patterns?
Trend analysis is an essential component of chart pattern analysis. Traders analyze the direction and strength of trends to determine the likelihood of pattern formations. Price action refers to the movement of the price itself and helps traders identify key levels, patterns, and market sentiment.
What are common mistakes to avoid in chart pattern trading?
Some common mistakes to avoid include relying solely on chart patterns without considering other factors, overtrading, and failing to use proper risk management techniques. Traders should also be aware that chart patterns are not foolproof and should be used in conjunction with other technical analysis tools.
