How the Moving Average Indicator Can Predict Profitable Trends
The moving average indicator is a widely used technical analysis tool in the stock market. It helps to smooth out price data and identify trends by calculating an average price over a specific time period. The indicator can be calculated using simple moving averages (SMA) or exponential moving averages (EMA). A rising moving average indicates an uptrend, while a declining moving average indicates a downtrend. Traders often use moving averages to determine support and resistance levels and to make predictions about future price movements.
Key Takeaways:
- The moving average indicator is a popular tool in technical analysis for predicting profitable trends.
- It calculates an average price over a specific time period to smooth out price data and identify trends.
- Simple moving averages (SMA) and exponential moving averages (EMA) are the two main types of moving averages.
- A rising moving average indicates an uptrend, while a declining moving average indicates a downtrend.
- Moving averages can be used to determine support and resistance levels and make predictions about future price movements.
What Is a Moving Average?
A moving average is a stock indicator commonly used in technical analysis. It helps to smooth out price data by creating an average price over a specified period. Moving averages can be calculated using simple arithmetic average (SMA) or weighted average (EMA) methods. The purpose of calculating the moving average is to mitigate the impact of random, short-term fluctuations in stock prices and identify long-term trends. Traders use moving averages to determine the overall direction of the market and make informed trading decisions.
How Moving Averages Work
Moving averages work by calculating the average price of a security over a specific time period. This average price is continuously updated as new data becomes available. The moving average acts as a trend-following indicator, smoothing out price fluctuations and allowing traders to identify the underlying trend in the market. By comparing the current price to the moving average, traders can determine whether the market is in an uptrend, a downtrend, or a sideways trend.
There are two common types of moving averages: simple moving averages (SMA) and exponential moving averages (EMA). SMAs give equal weight to each data point in the time period, while EMAs give more weight to recent data points. The choice between SMA and EMA depends on the trader’s preference and trading strategy. SMAs are more suitable for long-term trend analysis, while EMAs are often used for short-term trading strategies.
Overall, moving averages are valuable tools in technical analysis as they help traders identify trends, support and resistance levels, and potential trading opportunities. By incorporating moving averages into their analysis, traders can make more informed decisions and improve their chances of success in the stock market.
Table: Comparison of Simple Moving Average (SMA) and Exponential Moving Average (EMA)
| Indicator | Calculation Method | Weighting |
|---|---|---|
| Simple Moving Average (SMA) | Add up the closing prices over a specific time period and divide by the number of periods. | Equal weight to each data point in the time period. |
| Exponential Moving Average (EMA) | Calculate a smoothing factor based on the number of days in the time period. Multiply the previous EMA by the smoothing factor and add the current price multiplied by (1 minus the smoothing factor). | More weight to recent data points. |
Understanding Different Types of Moving Averages
When it comes to technical analysis, understanding different types of moving averages is crucial. The two main types are simple moving averages (SMA) and exponential moving averages (EMA). Both of these indicators have their own unique calculation methods and can provide valuable insights into market trends.
Simple Moving Average (SMA): This type of moving average is calculated by taking the arithmetic mean of the closing prices over a specific time period. For example, a 10-day SMA would add up the closing prices of the past 10 days and divide it by 10. The SMA provides a straightforward representation of the average price over a given time period and is often used to identify support and resistance levels.
Exponential Moving Average (EMA): Unlike the SMA, the EMA gives more weight to recent prices. It uses a smoothing factor and incorporates a larger portion of recent price data in its calculation. The EMA reacts more quickly to price changes compared to the SMA, making it useful for traders who prefer a more dynamic indicator. It is commonly used to identify short-term trends and potential trading opportunities.
Traders choose between SMA and EMA based on their trading objectives and time frame. The SMA is often favored by long-term traders who are interested in identifying long-lasting trends. On the other hand, the EMA is popular among short-term traders who want to react quickly to market changes. By understanding the differences between these moving averages, traders can make informed decisions and develop effective trading strategies.

Table: Comparison of SMA and EMA
| Simple Moving Average (SMA) | Exponential Moving Average (EMA) |
|---|---|
| Calculates the average price over a specific time period | Gives more weight to recent prices |
| React more slowly to price changes | React more quickly to price changes |
| Preferred by long-term traders | Preferred by short-term traders |
| Used to identify long-lasting trends | Used to identify short-term trends |
How Moving Averages Are Used in Technical Analysis
In technical analysis, moving averages play a crucial role in determining trend direction, identifying support and resistance levels, and developing effective trading strategies. Traders utilize moving averages as a tool to analyze the overall market sentiment and make informed trading decisions. By understanding how moving averages are used in technical analysis, traders can gain valuable insights into market trends and improve their chances of success.
Trend Direction
One of the primary uses of moving averages is to determine the direction of a trend. By plotting moving averages on a chart, traders can visually assess whether the market is in an uptrend, a downtrend, or moving sideways. When the price is consistently above a moving average, it indicates an uptrend, while a price below the moving average signifies a downtrend. Traders can use this information to align their trades with the prevailing trend and increase their profitability.
Support and Resistance Levels
Moving averages also help identify key support and resistance levels in the market. When the price approaches a moving average from below and bounces off, it acts as a support level. Conversely, when the price approaches a moving average from above and fails to break through, it acts as a resistance level. Traders can use these support and resistance levels to plan their entry and exit points, manage risk, and set profit targets.
Trading Strategy
Moving averages can form the basis of a trading strategy. One popular strategy is the moving average crossover, where a short-term moving average crosses above or below a long-term moving average. This crossover can serve as a signal for trend reversals or trend continuations. Traders can incorporate this signal into their trading strategy, using it to enter or exit trades and capture potential profits. By combining moving averages with other technical indicators, traders can further refine their strategies and improve their trading outcomes.
| Pros | Cons | |
|---|---|---|
| Pros | 1. Provides a clear visual representation of trend direction. | 1. Moving averages can lag behind price movements. |
| Cons | 2. Helps identify support and resistance levels. | 2. Moving averages may generate false signals during choppy or range-bound market conditions. |
| Overall | 3. Can be used to develop effective trading strategies. | 3. Moving averages should be used in conjunction with other technical indicators for more robust analysis. |
By incorporating moving averages into their technical analysis toolkit, traders can gain a deeper understanding of market trends and enhance their trading strategy. Whether used to identify trend direction, support and resistance levels, or as a basis for trading signals, moving averages provide valuable insights that can lead to profitable trading opportunities.
Using Moving Averages to Determine Market Momentum
Moving averages can be a valuable tool in determining market momentum and identifying potential trading opportunities. By analyzing the crossovers between short-term and long-term moving averages, traders can gauge whether the market is experiencing upward or downward momentum. These crossovers can be classified as either bullish or bearish, indicating a potential uptrend or downtrend, respectively.
“A bullish crossover occurs when a short-term moving average crosses above a long-term moving average, signaling potential upward momentum in the market.”
This bullish crossover suggests the possibility of a trend reversal and presents an opportunity for traders to enter into long positions. Conversely, a bearish crossover occurs when a short-term moving average crosses below a long-term moving average, indicating potential downward momentum in the market. This bearish crossover suggests the possibility of a trend reversal and presents an opportunity for traders to enter into short positions.
It is important for traders to consider the significance of these crossovers in the context of other technical indicators and market conditions. Confirmation from additional indicators, such as volume or oscillators, can provide further validation of the market momentum. Traders can also use stop-loss orders to manage their risk and protect their positions in case the momentum does not materialize as expected.
Example of Bullish and Bearish Crossovers
| Date | Price | 10-Day SMA | 50-Day SMA | Crossover | Momentum |
|---|---|---|---|---|---|
| Jan 1, 2022 | 100 | 95 | 90 | ||
| Jan 2, 2022 | 105 | 97 | 92 | ||
| Jan 3, 2022 | 110 | 100 | 94 | Bullish Crossover | Upward Momentum |
| Jan 4, 2022 | 108 | 102 | 96 | ||
| Jan 5, 2022 | 112 | 105 | 98 | ||
| Jan 6, 2022 | 116 | 108 | 100 | ||
| Jan 7, 2022 | 120 | 111 | 102 | ||
| Jan 8, 2022 | 115 | 113 | 104 | ||
| Jan 9, 2022 | 118 | 114 | 106 | ||
| Jan 10, 2022 | 125 | 117 | 109 | Bearish Crossover | Downward Momentum |
In the example above, a bullish crossover occurs on January 3rd when the 10-day simple moving average (SMA) crosses above the 50-day SMA. This indicates potential upward momentum in the market. Traders may consider entering long positions based on this signal. On the other hand, a bearish crossover occurs on January 10th when the 10-day SMA crosses below the 50-day SMA. This indicates potential downward momentum in the market. Traders may consider entering short positions based on this signal.
It is important to note that moving averages are not foolproof indicators and should be used in conjunction with other technical analysis tools and market research. Traders should also consider the overall market conditions and news events that may impact the stock or market they are trading.

Moving averages can be a valuable tool in determining market momentum and identifying potential trading opportunities. By analyzing the crossovers between short-term and long-term moving averages, traders can gauge whether the market is experiencing upward or downward momentum. These crossovers can be classified as either bullish or bearish, indicating a potential uptrend or downtrend, respectively.
Benefits of Using Moving Averages in Trading
Moving averages offer several benefits for traders in their trading strategy and technical analysis. By incorporating moving averages into their analysis, traders can enhance their decision-making process and improve their chances of making profitable trades.
1. Trend Identification
Moving averages are excellent tools for identifying trends in the market. By analyzing the slope and positioning of moving averages, traders can determine the overall direction of the market. Whether it’s an uptrend, downtrend, or sideways trend, moving averages provide valuable insights into the market’s momentum and help traders make informed trading decisions.
2. Support and Resistance Levels
Moving averages also help traders identify key support and resistance levels. These levels act as dynamic zones that the price tends to react to. When the price approaches a moving average, it may bounce off as support or resistance, indicating potential entry or exit points for traders. By using moving averages to identify these levels, traders can fine-tune their trading strategy and improve their timing.
3. Trading Strategy Development
By incorporating moving averages into their trading strategy, traders can develop systematic approaches based on technical analysis. Moving averages can be combined with other indicators, such as Bollinger Bands or MACD, to confirm trading signals and identify potential market trends. Traders can create trading strategies, such as moving average crossovers or trend following strategies, that align with their trading objectives and increase their chances of success.
| Benefits of Using Moving Averages in Trading |
|---|
| Trend Identification |
| Support and Resistance Levels |
| Trading Strategy Development |
By utilizing moving averages in trading, traders can gain valuable insights into market trends, support and resistance levels, and develop effective trading strategies. Moving averages provide a visual representation of price data, making it easier for traders to analyze market trends and patterns. Ultimately, incorporating moving averages into their trading approach can help traders make more informed trading decisions and improve their overall trading performance.
Different Types of Moving Averages and Their Formulas
In technical analysis, there are different types of moving averages that traders can utilize to gain insights into the market. The two most commonly used types are the simple moving average (SMA) and the exponential moving average (EMA). Let’s take a closer look at each type and their respective calculation formulas.
SMA (Simple Moving Average)
The simple moving average is calculated by adding up the closing prices over a specific time period and dividing the sum by the number of periods. For example, to calculate a 10-day SMA, you would add up the closing prices of the past 10 days and divide it by 10. The formula for SMA is as follows:
| Formula | Description |
|---|---|
| SMA = (Sum of Closing Prices) / (Number of Periods) | Calculates the average price over a specific time period using the closing prices |
EMA (Exponential Moving Average)
The exponential moving average gives more weight to recent prices, making it more sensitive to price changes than the simple moving average. The formula for EMA involves a smoothing factor that is calculated using the number of days in the time period. The formula for EMA is as follows:
| Formula | Description |
|---|---|
| EMA = (Closing Price – EMA Previous Day) x (Smoothing Factor) + EMA Previous Day | Calculates the average price over a specific time period, giving more weight to recent prices |
By understanding the different types of moving averages and their calculation formulas, traders can choose the most suitable type based on their trading objectives and time frame. These moving averages provide valuable insights into market trends and can be used to make informed trading decisions.
Using Moving Averages for Entry and Exit Points in Trading
When it comes to trading, one of the key factors for success is identifying the right entry and exit points. This is where moving averages can be extremely helpful. By analyzing the crossing points between price and moving averages, traders can make informed decisions about when to enter or exit a trade.
When the price crosses above a moving average, it can be seen as a potential entry point. This suggests that the trend may be reversing and turning bullish. Conversely, when the price crosses below a moving average, it can be considered an exit point, indicating a potential trend reversal and bearish market conditions.
By using moving averages as a guide, traders can effectively time their trades and capitalize on market trends. It’s important to note that the choice of moving average and time period will depend on the trader’s strategy and time frame. Shorter-term moving averages may be more effective for day traders, while longer-term moving averages can provide insights for swing traders or investors.
Example of Using Moving Averages for Entry and Exit Points
Let’s illustrate the concept with an example. Imagine a trader is using a 50-day simple moving average (SMA) as an entry and exit signal. If the price crosses above the 50-day SMA, it’s a signal to enter a long position. On the other hand, if the price crosses below the 50-day SMA, it’s a signal to exit the trade.
Table: Example of Entry and Exit Signals Using a 50-day SMA
| Date | Price | 50-day SMA | Signal |
|---|---|---|---|
| Jan 1 | $100 | $95 | Exit |
| Jan 10 | $110 | $100 | Enter |
| Jan 20 | $120 | $105 | Enter |
| Jan 30 | $105 | $110 | Exit |
In the example above, the trader would have exited the trade on January 1 when the price fell below the 50-day SMA. Then, they would have entered two new trades on January 10 and January 20 when the price crossed above the moving average. Finally, they would have exited the second trade on January 30 when the price crossed below the 50-day SMA again.
By using moving averages to determine entry and exit points, traders can increase their chances of making profitable trades. However, it’s important to remember that moving averages are not foolproof and should be used in conjunction with other analysis tools to validate signals and confirm market trends.
Using Moving Averages to Identify Overbought and Oversold Conditions
Moving averages can be a valuable tool for traders to identify overbought and oversold conditions in the market. When the price is above the moving average, it can indicate an overbought condition, suggesting that the price may be due for a correction or reversal. Conversely, when the price is below the moving average, it can indicate an oversold condition, suggesting that the price may be due for a bounce or reversal.
To further confirm these conditions, traders often use other technical indicators such as Bollinger Bands. Bollinger Bands are a popular volatility indicator that uses a moving average as its centerline and plots bands above and below the price. When the price reaches the upper band of the Bollinger Bands, it suggests an overbought condition, and when it reaches the lower band, it suggests an oversold condition.
By combining moving averages with Bollinger Bands, traders can have a more comprehensive view of the market and make better-informed trading decisions. The moving average provides an overall trend indication, while the Bollinger Bands help identify potential overbought or oversold levels. This combination can assist traders in timing their entries and exits more effectively, increasing their chances of making profitable trades.
| Indicator | Overbought Condition | Oversold Condition |
|---|---|---|
| Moving Average | The price is above the moving average | The price is below the moving average |
| Bollinger Bands | The price reaches the upper band | The price reaches the lower band |
It’s important to note that while overbought and oversold conditions suggest a potential reversal or correction, they do not guarantee it. Traders should always consider other factors such as market sentiment, volume, and additional technical indicators to confirm their analysis and make well-rounded trading decisions.
Combining Moving Averages with Other Technical Indicators
When it comes to technical analysis, moving averages can be a powerful tool on their own. However, when combined with other technical indicators, they can provide even more valuable insights into market trends and potential trading opportunities. Two popular indicators that can be used in conjunction with moving averages are Bollinger Bands and MACD (moving average convergence divergence).
Bollinger Bands utilize moving averages to plot bands above and below the price, which indicate volatility levels in the market. By analyzing the distance between the bands and the price, traders can gain insights into potential overbought or oversold conditions. This information can help traders make more informed decisions about when to enter or exit trades.
MACD, on the other hand, uses moving averages to identify crossovers and signal potential trend changes. By plotting a MACD line and a signal line on a chart, traders can look for crossovers between the two lines as a potential trading signal. This can be especially useful when combined with moving averages, as it provides additional confirmation of potential trend reversals or continuations.
Example of Combining Moving Averages with Bollinger Bands and MACD
Let’s take a look at an example of how moving averages, Bollinger Bands, and MACD can be combined to provide valuable insights for trading decisions. Imagine we are analyzing the price movement of a particular stock over the past 50 days.
| Date | Price | 50-day SMA | Bollinger Bands | MACD |
|---|---|---|---|---|
| Day 1 | $50 | $45 | Upper Band: $55 Lower Band: $35 |
MACD Line: 0.50 Signal Line: 0.30 |
| Day 2 | $55 | $47 | Upper Band: $60 Lower Band: $34 |
MACD Line: 0.60 Signal Line: 0.40 |
| Day 3 | $60 | $50 | Upper Band: $65 Lower Band: $45 |
MACD Line: 0.70 Signal Line: 0.50 |
In this example, we can see that the stock’s price is above the 50-day simple moving average, indicating an uptrend. The Bollinger Bands show that the price is approaching the upper band, suggesting that the stock may be overbought. Additionally, the MACD is showing an increasing trend, with the MACD line crossing above the signal line, indicating potential bullish momentum.
By combining these indicators, traders can gain a more comprehensive understanding of the stock’s price movement and make more informed trading decisions. However, it’s important to note that no indicator or combination of indicators can guarantee accurate predictions of future price movements. Traders should always conduct thorough analysis and consider multiple factors before making trading decisions.
Using Moving Averages for Trend Identification and Market Analysis
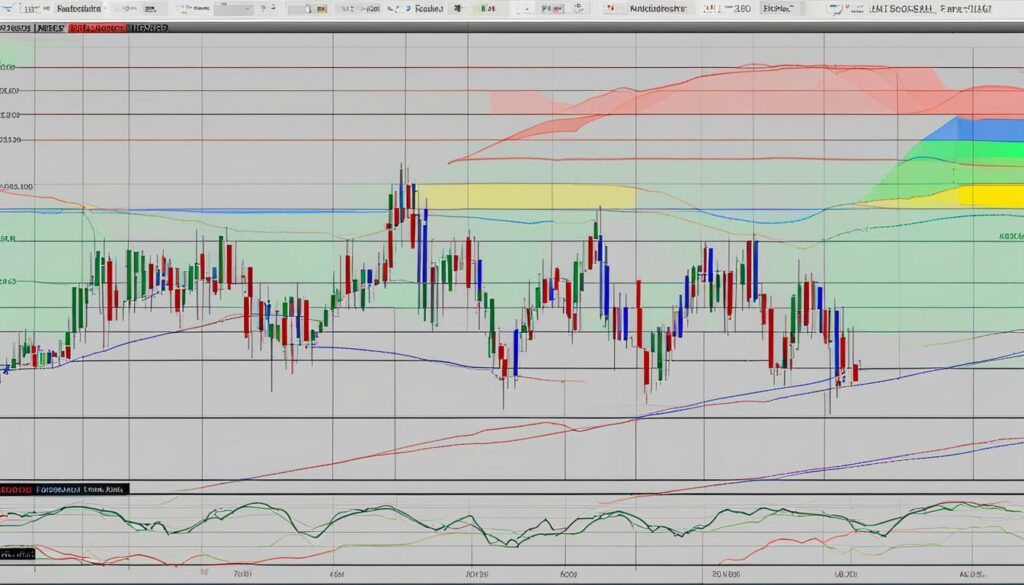
Moving averages are essential tools for trend identification and market analysis. Traders rely on moving averages to determine the overall direction of the market and identify potential trading opportunities. By analyzing the slope and positioning of moving averages, traders can differentiate between uptrends, downtrends, and sideways trends. This information is crucial for making informed trading decisions and developing effective trading strategies.
One of the key benefits of using moving averages for trend identification is their ability to smooth out price data and filter out short-term fluctuations. This allows traders to focus on the long-term trends and avoid getting caught up in noise. Moving averages provide a visual representation of market trends, making it easier for traders to analyze the current market conditions and predict future price movements.
Additionally, moving averages can be used in combination with other technical indicators to enhance market analysis. Traders often incorporate indicators like Bollinger Bands or MACD (moving average convergence divergence) to confirm trading signals and identify potential market trends. These indicators, when used together with moving averages, provide traders with a more comprehensive view of the market and help guide their trading decisions.

Overall, moving averages play a crucial role in trend identification and market analysis. Traders can use moving averages to determine the overall market direction, identify potential trading opportunities, and develop effective trading strategies. By leveraging the power of moving averages and combining them with other technical indicators, traders can gain valuable insights into the market and improve their chances of making profitable trades.
Conclusion
The moving average indicator is a powerful tool in technical analysis that traders can use to predict profitable trends in the stock market. By calculating an average price over a specific time period, moving averages help to smooth out price data and provide valuable insights into market trends.
Traders can leverage moving averages to identify key support and resistance levels, determine the overall direction of trends, and develop effective trading strategies. Moving averages act as dynamic levels of support and resistance, providing traders with crucial entry and exit points for their trades.
By incorporating moving averages into their analysis, traders can enhance their trading strategy and improve their chances of making profitable trades. The ability to identify trends and predict market movements is essential for successful trading, and the moving average indicator is a valuable tool in achieving this.
FAQ
How does the moving average indicator predict profitable trends?
The moving average indicator helps to smooth out price data and identify trends by calculating an average price over a specific time period. Traders use moving averages to determine support and resistance levels and make predictions about future price movements.
What is a moving average?
A moving average is a stock indicator commonly used in technical analysis. It helps to smooth out price data by creating an average price over a specified period. Traders use moving averages to determine the overall direction of the market and make informed trading decisions.
What are the different types of moving averages?
There are different types of moving averages, including simple moving averages (SMA) and exponential moving averages (EMA). SMA calculates the average price over a specific time period using the arithmetic mean, while EMA gives more weight to recent prices.
How are moving averages used in technical analysis?
Moving averages are used in technical analysis to determine trend direction, identify support and resistance levels, and develop trading strategies. Traders analyze moving averages to make informed trading decisions based on market trends and patterns.
How do moving averages help determine market momentum?
Moving averages can help determine market momentum by analyzing crossovers. A bullish crossover occurs when a short-term moving average crosses above a long-term moving average, indicating upward momentum. A bearish crossover occurs when a short-term moving average crosses below a long-term moving average, indicating downward momentum.
What are the benefits of using moving averages in trading?
Using moving averages in trading helps traders develop systematic strategies, identify trends and support/resistance levels, and make informed trading decisions based on technical analysis. Moving averages provide a visual representation of price data, making it easier for traders to analyze market trends and patterns.
How are different types of moving averages calculated?
Simple moving averages (SMA) are calculated by adding up the closing prices over a specific time period and dividing it by the number of periods. Exponential moving averages (EMA) use a smoothing factor that gives more weight to recent prices.
How can moving averages be used for entry and exit points in trading?
Traders can enter a position when the price crosses above or below a moving average, indicating a potential trend reversal or continuation. They can exit a position when the price crosses back above or below the moving average, indicating a potential trend reversal.
How do moving averages help identify overbought and oversold conditions?
When the price is above a moving average, it can indicate an overbought condition, suggesting a potential correction or reversal. When the price is below a moving average, it can indicate an oversold condition, suggesting a potential bounce or reversal.
How can moving averages be combined with other technical indicators?
Moving averages can be combined with other technical indicators, such as Bollinger Bands or MACD, to confirm trading signals and identify potential trends. Bollinger Bands use moving averages to plot volatility levels, while MACD uses moving averages to identify crossovers and signal trend changes.
How are moving averages used for trend identification and market analysis?
Moving averages help traders determine the overall direction of the market and identify potential trading opportunities. By analyzing the slope and positioning of moving averages, traders can differentiate between uptrends, downtrends, and sideways trends. Moving averages also help develop trading strategies based on trend following or mean reversion.
Do moving averages guarantee profitable trends?
While moving averages are powerful tools for trend identification, they do not guarantee profitable trends. Traders should use moving averages in conjunction with other technical analysis tools and consider other factors, such as market conditions, to make informed trading decisions.
