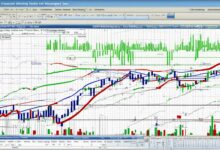
Triangle Chart Pattern Explained
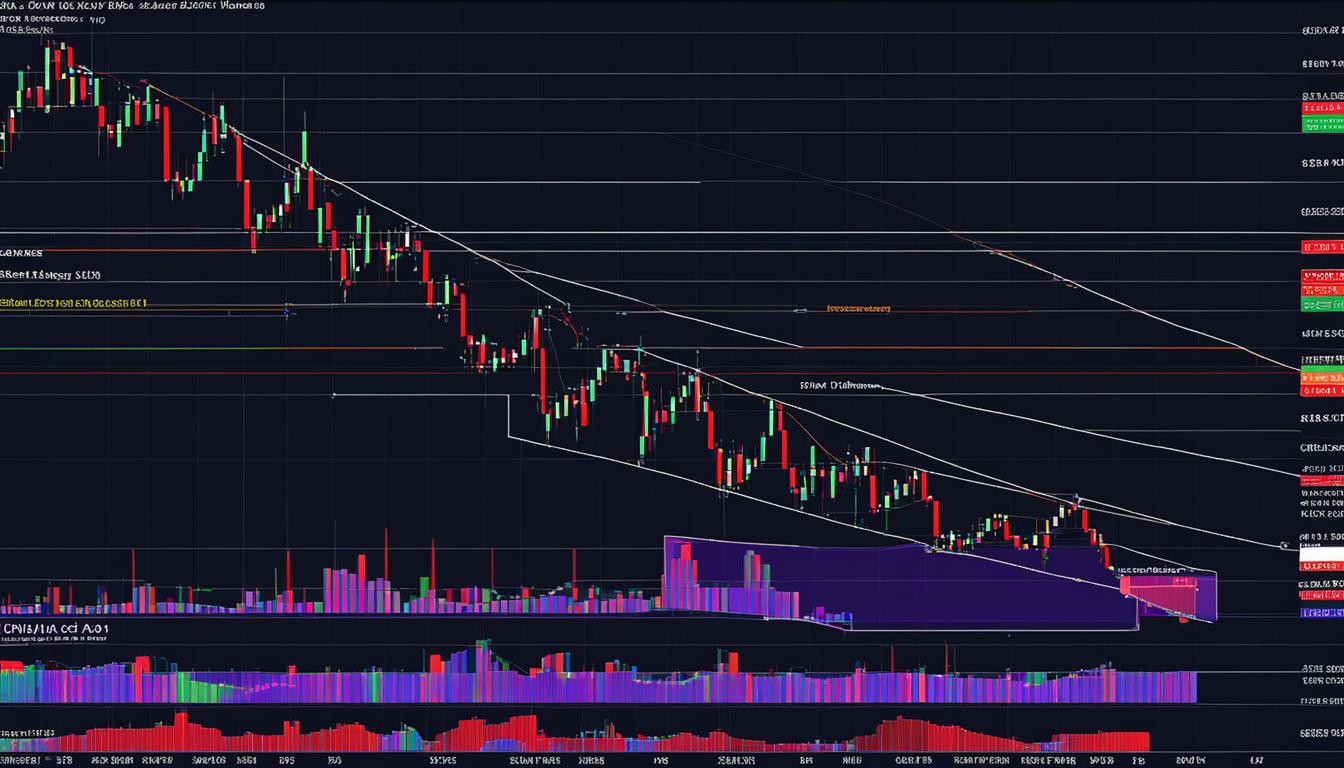
In technical analysis, a triangle is a continuation pattern on a chart that forms a triangle-like shape. There are three different types of triangles: ascending, descending, and symmetrical. Triangles can be best described as horizontal trading patterns. At the start of its formation, the triangle is at its widest point. As the market continues to trade in a sideways pattern, the range of trading narrows and the point of the triangle is formed.
Key Takeaways:
- Triangle patterns are continuation patterns on a chart that indicate a pause in the market’s trend.
- There are three main types of triangles: ascending, descending, and symmetrical.
- Traders can use triangle patterns to identify potential entry and exit points in the market.
- Confirmation of breakouts and consideration of trading volume are important when trading triangle patterns.
- Triangle patterns can be used on various timescales, from daily charts to shorter intraday timeframes.
Ascending Triangle Pattern
An ascending triangle is a bullish chart pattern that occurs during an uptrend. It is characterized by a rising lower trendline and two highs that are close to each other. Traders look for an increase in trading volume as an indication that new highs will form. The entry point for traders is when the price breaks through the top line of the triangle with increased volume.
When analyzing the ascending triangle pattern, it is important to pay attention to the slope of the lower trendline. The upward slope indicates that buyers are stepping in at higher prices, pushing the price higher. This suggests a bullish sentiment and a potential continuation of the uptrend.
Volume is another key factor in trading the ascending triangle pattern. As the price approaches the apex of the triangle, traders look for a volume surge, which suggests that buyers are becoming more aggressive and likely to drive the price above the resistance level. Increased volume confirms the breakout and provides traders with more confidence in their entry decisions.

In summary, the ascending triangle pattern is a bullish chart pattern that occurs during an uptrend. Traders look for a rising lower trendline, two highs close to each other, and an increase in trading volume as potential entry signals. The breakout above the resistance level with increased volume confirms the pattern and provides traders with an opportunity to participate in the potential continuation of the uptrend.
Key Points:
- An ascending triangle is a bullish chart pattern that occurs during an uptrend.
- It is characterized by a rising lower trendline and two highs that are close to each other.
- Traders look for an increase in trading volume as an indication of potential new highs.
- The entry point is when the price breaks through the top line of the triangle with increased volume.
Descending Triangle Pattern
In technical analysis, the descending triangle pattern is a bearish chart pattern that occurs during a downtrend. It is characterized by a falling upper trendline and two lows that are close to each other. This pattern represents a period of consolidation where sellers become more aggressive, testing the support level until a breakout occurs.
Traders often look for an increase in trading volume as a signal for a potential breakout. Once the price breaks below the support line of the triangle with increased volume, it confirms the bearish bias and provides an entry point for traders to short the asset. The target for this pattern is estimated by measuring the height of the triangle and projecting it downwards from the breakout point.
The descending triangle pattern is widely used by technical analysts to identify potential bearish opportunities in the market. It is important to note that no pattern is foolproof, and it is always advisable to wait for confirmation before making any trading decisions. Taking into account other technical indicators and market trends can provide additional insights and increase the probability of successful trades.
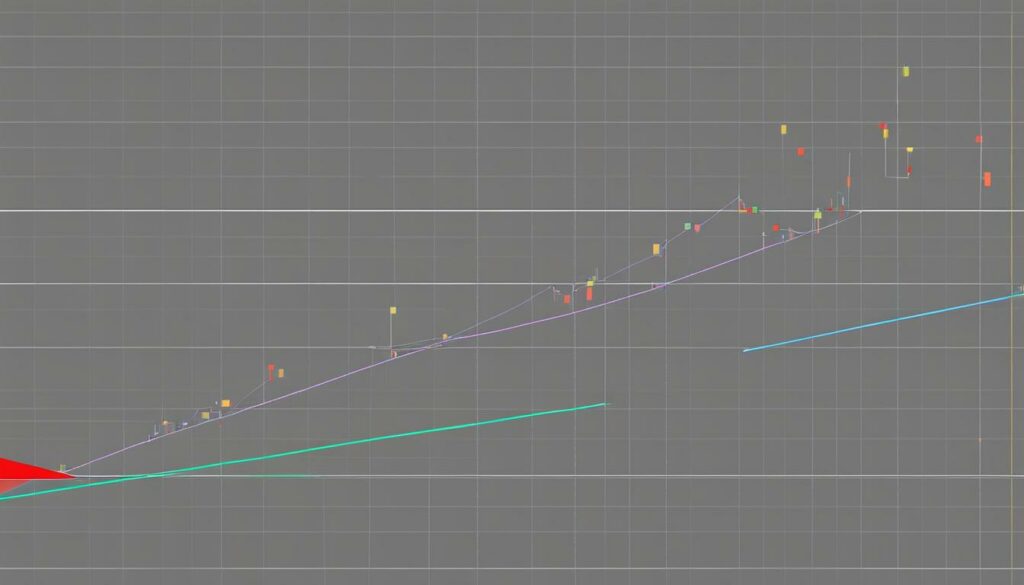
Table: Example of a Descending Triangle Pattern
| Date | High | Low |
|---|---|---|
| Day 1 | 10.00 | 8.50 |
| Day 2 | 9.50 | 8.75 |
| Day 3 | 9.00 | 8.70 |
| Day 4 | 8.90 | 8.50 |
| Day 5 | 9.00 | 8.30 |
Source: Own elaboration.
Symmetrical Triangle Pattern
The symmetrical triangle pattern is a common chart formation that occurs during a period of indecision in the market. It is characterized by converging trendlines and a lack of significant volume. The symmetrical triangle pattern suggests that buyers and sellers are evenly matched, testing the price until one side gains control and a breakout occurs. Traders can enter the market at the breakout point, taking advantage of the subsequent price movement.
To better understand the symmetrical triangle pattern, let’s take a look at the following table:
| Trendline | Description |
|---|---|
| Upper Trendline | This trendline connects the higher highs of the pattern and acts as a resistance level. It indicates the upper boundary of the trading range. |
| Lower Trendline | This trendline connects the lower lows of the pattern and acts as a support level. It indicates the lower boundary of the trading range. |
| Breakout Point | This is the point at which the price breaks out of the symmetrical triangle pattern. Traders can enter the market at this point to take advantage of the subsequent price movement. |
It is important to note that the symmetrical triangle pattern can result in a bullish or bearish breakout, depending on the direction of the prior trend. If the breakout occurs in the direction of the prior trend, it is considered a confirmation of the trend continuation. Traders can use technical indicators, such as volume and momentum, to confirm the strength of the breakout and guide their trading decisions.

How to Trade Triangle Patterns
Trading triangle patterns can be a profitable strategy for traders looking to capitalize on price breakouts and trend continuations. By understanding the key principles of triangle pattern trading, traders can identify potential entry and exit points with increased accuracy.
When trading triangle patterns, it is important to wait for a confirmed breakout before entering a trade. This confirmation can be obtained by seeing the price break above or below the trendlines of the triangle with increased trading volume. By waiting for confirmation, traders can reduce the risk of false breakouts and increase the probability of successful trades.
Once a breakout has been confirmed, traders can set entry orders above the slope of the lower highs for a bullish breakout or below the slope of the higher lows for a bearish breakout. This allows traders to enter the market in the direction of the breakout and take advantage of potential price movements.
Additionally, when trading triangle patterns, it is important to consider the apex and breakout price levels as potential support or resistance levels. These levels can provide additional confirmation for trading decisions and help determine profit targets. Traders can also use the distance from the apex to the base of the lower trendline to estimate a price target for the trade.
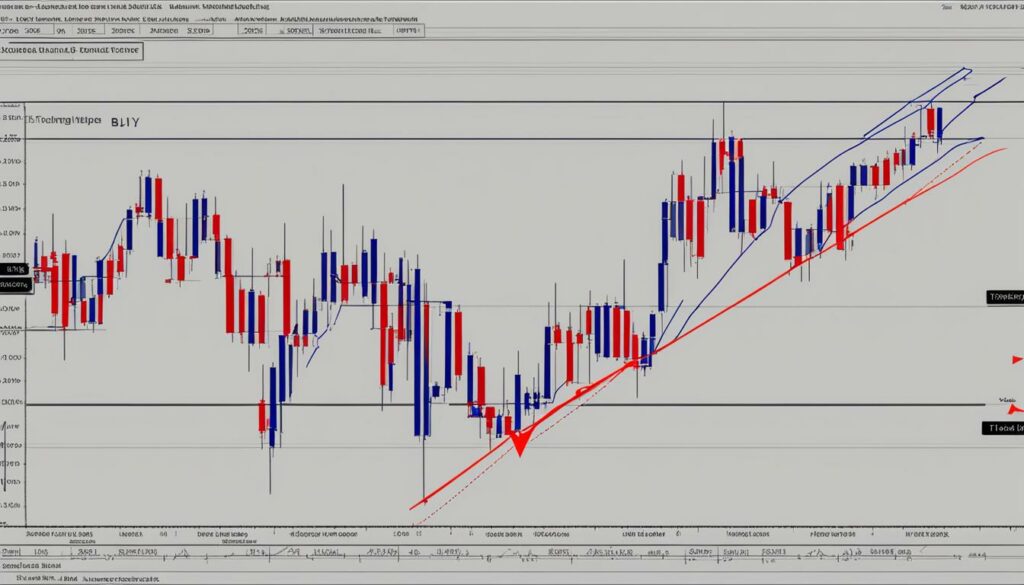
Table: Example Triangle Pattern Trade Setup
| Trade Setup | Description |
|---|---|
| Pattern Type | Symmetrical Triangle |
| Breakout Direction | Bullish |
| Confirmed Breakout Price | $50 |
| Entry Order | Above slope of lower highs |
| Stop Loss | Below breakout price |
| Take Profit | Distance from apex to base of lower trendline |
In summary, triangle pattern trading can be a valuable tool for traders to identify potential breakout opportunities and trend continuations. By waiting for confirmation, setting entry orders, and considering important price levels, traders can maximize their chances of success when trading triangle patterns.
Triangle Pattern Timescales
When it comes to analyzing and trading triangle patterns, it’s important to consider the timescale in which they occur. While triangles can be applied to various markets, including forex, their formation and breakout times can vary significantly.
On average, triangle patterns are commonly observed on daily charts and can last anywhere from one to three months or even longer before a breakout occurs. However, it’s worth noting that strong triangle patterns typically require a prior trend that is at least a few months old. This indicates that triangles are often a result of a consolidation phase following a significant move in the market.
Traders can also use triangle patterns for trading on shorter timescales, such as intraday or weekly charts. However, it’s important to understand that interpreting and trading these patterns on shorter timescales may be more subjective. Therefore, it requires a keen eye for identifying the formation and breakout of triangles within a shorter timeframe.
Table: Comparison of Triangle Pattern Timescales
| Timescale | Duration | Considerations |
|---|---|---|
| Daily Charts | One to three months or longer | Strong triangle patterns require a prior trend of at least a few months. |
| Shorter Timescales | Intraday or weekly charts | Interpreting and trading triangles on shorter timescales may be more subjective. |
In conclusion, triangle patterns are versatile tools in technical analysis, used to identify continuation or reversal patterns in the market. While they commonly occur on daily charts and can last for months before a breakout, traders can also interpret and trade triangles on shorter timescales. Understanding the timescale in which triangles form and break out is crucial for effectively incorporating them into trading strategies.
Triangle Patterns Simplified
Trading triangle patterns can be a powerful strategy for identifying potential breakout opportunities in the market. These patterns represent underlying patterns of consolidation, accumulation, or distribution, providing valuable insights into market sentiment. Triangle patterns are straightforward to interpret and confirm, making them a popular choice among technical analysts and traders.
In a symmetrical triangle, both bullish and bearish traders are testing the price, creating a period of indecision. As the triangle formation continues, buyers and sellers even out until one side wins out, resulting in a breakout. This breakout can establish new support and resistance levels, giving traders clear entry and exit points.
“In an ascending triangle, buyers become more aggressive over time, pushing the price against a resistance level. Once the price breaks out above the resistance line, it signals a bullish breakout. Conversely, in a descending triangle, sellers become more aggressive, driving the price down against a support level. A breakout below the support line indicates a bearish breakout.”
When trading triangle patterns, it is crucial to confirm breakouts and consider the strength of the volume. An increase in trading volume during a breakout is a strong indication of the market’s conviction in the direction of the breakout. Traders can set entry orders above the slope of the lower highs for bullish breakouts and below the slope of the higher lows for bearish breakouts, ensuring they ride the momentum of the breakout.
Benefits of Triangle Patterns:
- Clear entry and exit points
- Establish new support and resistance levels
- Provide insights into market sentiment
- Opportunities for breakouts and trend continuation
By understanding the simplified mechanics of triangle patterns, traders can confidently incorporate them into their trading strategies. These patterns offer valuable insights into market sentiment and can help identify potential breakout opportunities. Remember to always confirm breakouts and consider the strength of volume before executing trades based on triangle patterns.
| Pattern Type | Description | Breakout Direction |
|---|---|---|
| Symmetrical Triangle | Indecision pattern with converging trendlines | Bullish or bearish, depending on breakout direction |
| Ascending Triangle | Pattern with rising lower trendline and two close highs | Bullish, breaks out above resistance line |
| Descending Triangle | Pattern with falling upper trendline and two close lows | Bearish, breaks out below support line |
Example: Symmetrical Triangle Pattern
In technical analysis, the symmetrical triangle pattern is one of the most common continuation patterns that traders look for. It occurs when the price consolidates, forming lower highs and higher lows, within converging trendlines. This pattern represents a period of indecision in the market, as the bulls and bears battle it out for control.
When trading the symmetrical triangle pattern, it is essential to wait for a breakout confirmation. Traders often place entry orders above the slope of the lower highs and below the slope of the higher lows, anticipating a strong move in the direction of the breakout. Increased trading volume is another crucial factor to consider when confirming the breakout.
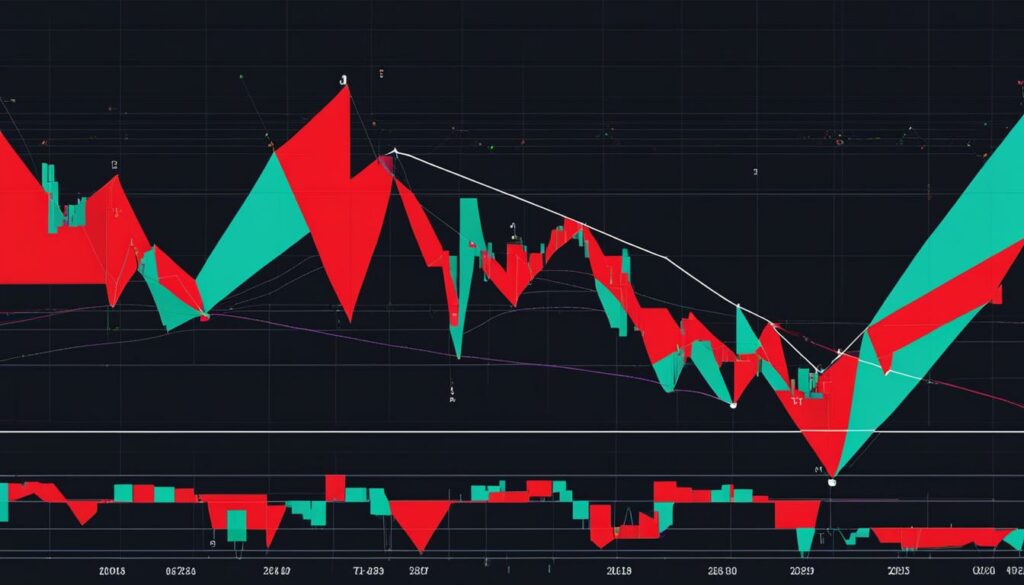
For example, in the image below, we can see a symmetrical triangle pattern forming after an extended uptrend. The breakout occurs to the upside, following the prior trend, and is accompanied by a significant increase in trading volume. Traders could have set entry orders above the resistance line and below the slope of the higher lows, taking advantage of the breakout opportunity.
Example: Ascending Triangle Pattern
In an ascending triangle pattern, buyers gradually push the price up against a resistance level. This pattern is characterized by a rising lower trendline and two highs that are close to each other. The breakout from an ascending triangle can be either bullish or bearish, so it’s important for traders to be prepared for movement in either direction.
Traders can set entry orders above the resistance line and below the slope of the higher lows. By doing so, they can take advantage of the breakout opportunity when the price surpasses the resistance level. It is also crucial to confirm the breakout before entering the trade. One way to confirm the breakout is to look for an increase in trading volume, as this can indicate strong upward momentum.
Here is an example of an ascending triangle pattern:

Example: Ascending Triangle Pattern
| Date | High | Low | Volume |
|---|---|---|---|
| January 1 | 10.00 | 9.50 | 100,000 |
| January 2 | 10.10 | 9.80 | 150,000 |
| January 3 | 10.20 | 10.00 | 200,000 |
| January 4 | 10.30 | 10.10 | 180,000 |
| January 5 | 10.40 | 10.20 | 250,000 |
| January 6 | 10.50 | 10.30 | 300,000 |
| January 7 | 10.60 | 10.40 | 400,000 |
| January 8 | 10.70 | 10.40 | 500,000 |
| January 9 | 10.80 | 10.50 | 600,000 |
| January 10 | 11.00 | 10.60 | 700,000 |
As depicted in this example, the price gradually rises against the resistance level, forming higher lows and almost equal highs. Traders can set their entry orders above the resistance line, anticipating a breakout. Once the breakout occurs, they can take advantage of the upward momentum and ride the trend for potential profits.
Example: Descending Triangle Pattern
When analyzing chart patterns, the descending triangle is a bearish pattern that signals a potential continuation of a downtrend. It is formed by a horizontal support line and a downward sloping resistance line. This pattern indicates that sellers are becoming more aggressive, pushing the price down against the support level. As the price continues to test the support line, it creates a series of lower highs, forming the descending triangle.
To trade the descending triangle pattern, traders can set entry orders below the support line and above the resistance line. The breakout can be either bearish or bullish, so it’s important to be prepared for movement in either direction. Confirming the breakout with increased trading volume can provide additional confirmation for traders.
Here is an example of a descending triangle pattern:
| Date | Price |
|---|---|
| Day 1 | $100 |
| Day 2 | $105 |
| Day 3 | $102 |
| Day 4 | $98 |
| Day 5 | $97 |
| Day 6 | $99 |
In this example, the support line is formed by the series of lower lows at the $97 level, while the resistance line is the downward sloping line connecting the lower highs. Traders can set entry orders below $97 to capture a potential downside breakout. Confirmation of the breakout should be sought through increased trading volume.
Conclusion
In conclusion, triangle patterns are an essential tool in technical analysis for traders seeking to identify potential trading opportunities. Whether you are a beginner or an experienced trader, understanding the different types of triangle patterns – ascending, descending, and symmetrical – can provide valuable insights into market trends and potential breakouts.
By analyzing triangle patterns, traders can determine entry and exit points based on the breakout of the pattern. It is crucial to confirm breakouts and consider the strength of the volume before executing trades. This will help ensure more accurate predictions and increase the chances of successful trades.
Technical analysis, along with the use of triangle chart patterns, provides a systematic approach to trading that can be applied across various financial markets. By employing a triangle breakout strategy, traders can capitalize on the continuation or reversal of the previous trend, making informed decisions based on market conditions and price movements.
FAQ
What is a triangle chart pattern?
A triangle chart pattern is a continuation pattern on a chart that forms a triangle-like shape. It is a horizontal trading pattern that represents consolidation in the market.
How many types of triangles are there?
There are three different types of triangles: ascending, descending, and symmetrical.
What is an ascending triangle pattern?
An ascending triangle pattern is a bullish chart pattern that occurs during an uptrend. It is characterized by a rising lower trendline and two highs that are close to each other.
What is a descending triangle pattern?
A descending triangle pattern is a bearish chart pattern that occurs during a downtrend. It is characterized by a falling upper trendline and two lows that are close to each other.
What is a symmetrical triangle pattern?
A symmetrical triangle pattern is a chart pattern that forms during a period of indecision in the market. It is characterized by converging trendlines and lack of significant volume.
How can traders enter the market using triangle patterns?
Traders can place entry orders above the slope of the lower highs and below the slope of the higher lows of the triangle.
How long do triangle patterns typically last?
Triangle patterns can last for one to three months or more before a breakout occurs.
Why do triangle patterns work?
Triangle patterns work because they represent underlying patterns of consolidation, accumulation, or distribution in the market.
What should traders consider before trading triangle patterns?
Traders should confirm breakouts, consider the strength of the volume, and establish support and resistance levels.
Can triangle patterns be used for shorter timescales?
Yes, triangle patterns can be used for shorter timescales, although the interpretation may be more subjective.
How can traders estimate a price target using triangle patterns?
Traders can use the distance from the apex to the base of the lower trendline to estimate a price target.
