Volatility Smile: What Is It? Why Is It Important?
A volatility smile is a graph that shows the relationship between the strike price and implied volatility of options with the same underlying asset and expiration date. It gets its name from the smiling shape it forms. The smile indicates that the options that are furthest in-the-money or out-of-the-money tend to have higher implied volatility. This phenomenon is not observed in all options but is more common in near-term equity options and currency-related options. The volatility smile is significant because it provides insights into the market’s expectations of future price movements and risk.
Key Takeaways:
- The volatility smile is a graph that illustrates the relationship between strike price and implied volatility of options.
- Options that are further in-the-money or out-of-the-money tend to have higher implied volatility, resulting in a smile shape.
- The volatility smile provides insights into market expectations of future price movements and risk.
- It is commonly observed in near-term equity options and currency-related options.
- Understanding the volatility smile is crucial for effective option trading and risk management.
Unlocking the secrets of the volatility smile can greatly enhance your options trading strategies. By understanding the relationship between strike price and implied volatility, you can evaluate the value and risk of different options, identify opportunities for trading, and make more informed decisions. The volatility smile is a powerful tool for assessing market expectations and managing risk in the options market.
Understanding Implied Volatility and Options Pricing
Implied volatility is a critical factor in options pricing, as it reflects the market’s expectation of future price volatility. Traders closely analyze implied volatility to assess the potential risks and returns of trading options. Options with higher implied volatility tend to be more expensive, as they carry a higher probability of larger price swings.
Traders employ various strategies and analysis techniques to capitalize on options pricing based on implied volatility. Delta-neutral strategies, such as straddles and variance swaps, aim to profit from changes in volatility without being exposed to directional price movements. Volatility arbitrage involves exploiting pricing discrepancies between options with different implied volatilities. These strategies require a deep understanding of implied volatility and its impact on options pricing.
When trading options, it is essential to consider the relationship between implied volatility and the strike price. The volatility smile, which depicts the relationship between implied volatility and strike price, can provide valuable insights for option analysis. By comparing options with different strike prices but the same underlying asset and expiration date, traders can determine whether the implied volatility levels align with the volatility smile. This information helps traders assess the relative attractiveness of different options and create positions that align with their risk and return objectives.

Option Strategies Utilizing Implied Volatility
Traders employ various option strategies to take advantage of implied volatility. Here are some commonly used strategies:
- Straddle: This strategy involves buying both a call option and a put option with the same strike price and expiration date. Traders use the straddle strategy when they anticipate a significant price move but are uncertain about the direction. The goal is to profit from the increase in implied volatility and the subsequent rise in option prices.
- Iron Condor: The iron condor strategy involves selling both a call spread and a put spread on the same underlying asset. Traders use this strategy when they expect a decrease in implied volatility and relatively stable price movements. The iron condor allows traders to profit from the decay in option prices and the contraction of the volatility smile.
- Butterfly Spread: This strategy involves trading options with three different strike prices but the same expiration date. Traders utilize this strategy when they anticipate a modest price move and a decrease in implied volatility. The goal is to profit from the contraction of the volatility smile and the subsequent decline in option prices.
These option strategies demonstrate the importance of understanding implied volatility and its impact on options pricing. Traders can leverage their knowledge of implied volatility to create profitable trading strategies and manage their risk effectively in the options market.
The Origins and Evolution of the Volatility Smile
The volatility smile, which is the graphical representation of the relationship between strike price and implied volatility, emerged as a result of the 1987 stock market crash. Prior to this event, options markets predominantly adhered to the assumptions of the Black-Scholes model, which posits a flat implied volatility curve. However, the crash served as a stark reminder that extreme events can occur, leading to significant price shifts and market skew.

To account for these risks, options pricing models evolved and gave rise to the volatility smile. This smile reflects the market’s recognition that in-the-money and out-of-the-money options are in higher demand compared to at-the-money options. It also factors in the potential for large price shifts and extreme events. The volatility smile is particularly prominent in near-term equity options and currency-related options, where it provides valuable insights into the market’s expectations of future price movements and risk.
| Key Takeaways: |
|---|
| – Volatility smile emerged after the 1987 stock market crash. |
| – Prior to the crash, options markets followed the assumptions of the Black-Scholes model. |
| – The crash highlighted the potential for extreme events and significant price shifts. |
| – Options pricing models evolved to account for these risks, giving rise to the volatility smile. |
| – The smile reflects the market’s recognition of higher demand for in-the-money and out-of-the-money options. |
Key Factors Influencing the Volatility Smile:
- Market sentiment and expectations of potential price swings.
- Demand and supply dynamics in the options market.
- Variations across different strikes and expirations, forming a volatility surface.
Interpreting the Volatility Smile in Practice
When it comes to option trading strategies, understanding and interpreting the volatility smile is of utmost importance. The volatility smile indicates the relationship between strike prices and implied volatility of options with the same underlying asset and expiration date. By analyzing the shape of the smile, traders can gain valuable insights into the market’s expectations of future price movements and risk.
One key observation from the volatility smile is that options that are further in-the-money or out-of-the-money tend to have higher implied volatility. This information can assist traders in assessing the relative attractiveness of different options and developing positions that align with their risk and return objectives. By comparing options with different strike prices but the same underlying asset and expiration date, traders can determine if options further away from the strike price have similar implied volatility levels.
Additionally, understanding the volatility smile is essential for evaluating the sensitivities of options to changes in factors such as delta, gamma, and vega, which are commonly referred to as the option Greeks. These measures reflect the impact of changes in the underlying asset’s price, time decay, and implied volatility on option prices. By considering these factors, traders can make more informed decisions when it comes to selecting and managing their option positions.
| Option Greek | Description |
|---|---|
| Delta | Measures the sensitivity of option price to changes in the underlying asset’s price. |
| Gamma | Indicates the rate at which delta changes for every one-point move in the underlying asset’s price. |
| Vega | Quantifies the impact of changes in implied volatility on option prices. |
Interpreting the Volatility Smile in Practice
When analyzing the volatility smile, certain considerations should be kept in mind. It is important to establish whether a particular option aligns with a volatility smile or if the implied volatility is better represented by a reverse or forward skew. Additionally, market dynamics and factors such as supply and demand can influence option pricing and result in a less clean U-shape in the volatility smile.
Traders should use the volatility smile as a tool in conjunction with other indicators and analysis techniques when making trading decisions. Taking a holistic approach and considering multiple factors can help traders make more well-informed and robust decisions in the dynamic options market.

By incorporating an understanding of the volatility smile into option pricing models and trading strategies, traders can gain a competitive edge in the options market and potentially enhance their risk-adjusted returns.
Summary
The volatility smile provides valuable insights into market expectations of future price movements and risk. It helps traders assess the relative attractiveness of different options and evaluate the sensitivities of options to changes in factors such as delta, gamma, and vega. However, traders must also consider other indicators and market dynamics to make well-informed trading decisions. By incorporating an understanding of the volatility smile into their trading strategies, traders can potentially enhance their performance in the options market.
Factors Influencing the Shape of the Volatility Smile
The shape of the volatility smile is influenced by various factors that impact the options market. Understanding these factors is crucial for traders and investors seeking to navigate the complexities of options pricing and volatility trading. Let’s explore some of the key factors that contribute to the shape of the volatility smile.
Risk Reversal
One factor influencing the shape of the volatility smile is the concept of risk reversal. Risk reversal refers to the difference in implied volatility between out-of-the-money put options and out-of-the-money call options with the same expiration date. When the implied volatility of put options is higher than that of call options, it indicates a more negative market sentiment and a preference for downside protection. This can contribute to a steeper slope on the left side of the volatility smile, creating a U-shaped curve.
On the other hand, when the implied volatility of call options is higher than that of put options, it suggests a more positive market sentiment and a preference for upside potential. This can lead to a steeper slope on the right side of the volatility smile, mirroring the U-shape on the left side.
Volatility Surface
In addition to risk reversal, the shape of the volatility smile can also be influenced by the volatility surface. The volatility surface refers to the implied volatility levels across different strikes and expirations for a specific underlying asset. It provides a detailed view of how implied volatility varies within an options market.
Traders analyze the volatility surface to identify patterns, trends, and anomalies that can help inform their trading strategies. By understanding the dynamics of the volatility surface, traders can gain insights into the market’s expectations of future price movements and potential risks.
Other Factors
Other factors that can influence the shape of the volatility smile include supply and demand dynamics, market sentiment, and expectations of potential price swings. These factors can contribute to changes in implied volatility levels across different strike prices and expirations, resulting in variations in the shape of the volatility smile.
Summary
The shape of the volatility smile is influenced by multiple factors, including risk reversal, the volatility surface, supply and demand dynamics, and market sentiment. Understanding these factors is essential for traders and investors seeking to navigate the options market and make informed decisions based on the implied volatility of options. By analyzing the shape of the volatility smile, market participants can gain valuable insights into market expectations and potential risks.
Limitations and Considerations with the Volatility Smile
The volatility smile is a valuable tool for traders and investors in assessing the market’s expectations and potential risks associated with options. However, it is important to understand the limitations and considerations when using the volatility smile as a sole indicator.
One of the main limitations is the assumption made by the Black-Scholes model, which assumes a flat implied volatility curve. This model may not accurately capture the dynamics of the options market, especially during periods of extreme events. Traders need to consider the possibility that the implied volatility may be better represented by a reverse or forward skew, rather than a U-shaped smile.
Moreover, the volatility smile is influenced by factors other than implied volatility, such as supply and demand dynamics in the options market. These factors can result in deviations from the expected U-shaped smile, leading to a less clean and predictable shape. Traders should take into account these market dynamics and consider multiple factors when making trading decisions.
Table: Limitations and Considerations with the Volatility Smile
| Limitations | Considerations |
|---|---|
| Black-Scholes model assumption of a flat implied volatility curve | Consider alternative options pricing models |
| Market dynamics and supply and demand factors | Assess the impact on options pricing and risk assessment |
| Deviation from the U-shaped smile | Consider other volatility patterns, such as skew or smirk |
Traders should approach the volatility smile as one factor among many in their options trading strategies. It is important to analyze the market environment, incorporate other indicators, such as option Greeks, and consider the limitations and variations in the volatility smile. By taking a comprehensive approach to options trading and risk management, traders can make more informed decisions and navigate the complexities of the options market.
The Difference Between Volatility Smile and Volatility Skew/Smirk
While the volatility smile is commonly observed in near-term equity options and currency-related options, there are other variations in the shape of implied volatility curves, such as volatility skew and smirk. Understanding the difference between these terms is crucial for options traders and investors.
Volatility Skew
A volatility skew refers to a situation where in-the-money (ITM) or out-of-the-money (OTM) options have higher implied volatility than at-the-money (ATM) options. This phenomenon is often observed in index options and long-term equity options. The skew indicates that market participants perceive higher risks and potential price swings in the options that are further away from the current market price.
For example, in an equity options market with a volatility skew, a call option with a strike price below the current market price may have a higher implied volatility compared to a call option with a strike price at the current market price. Similarly, a put option with a strike price above the current market price may have a higher implied volatility compared to a put option with a strike price at the current market price.
Volatility Smirk
A volatility smirk, on the other hand, represents a situation where the implied volatility is higher for options at the same ATM level but with different expirations. This phenomenon is often seen in options with shorter expirations, and it implies that market participants expect higher volatility in the near term.
For example, in a currency options market with a volatility smirk, options with the same strike price and at-the-money level but with different expiration dates may have different implied volatilities. The options with shorter expiration dates may have higher implied volatilities compared to options with longer expiration dates, indicating expectations of increased volatility in the short term.
The variations in the shape of implied volatility curves, including the volatility smile, skew, and smirk, demonstrate the complexities of options pricing and the market’s perception of risk. Traders and investors need to carefully analyze these volatility patterns to make informed decisions and develop effective trading strategies.
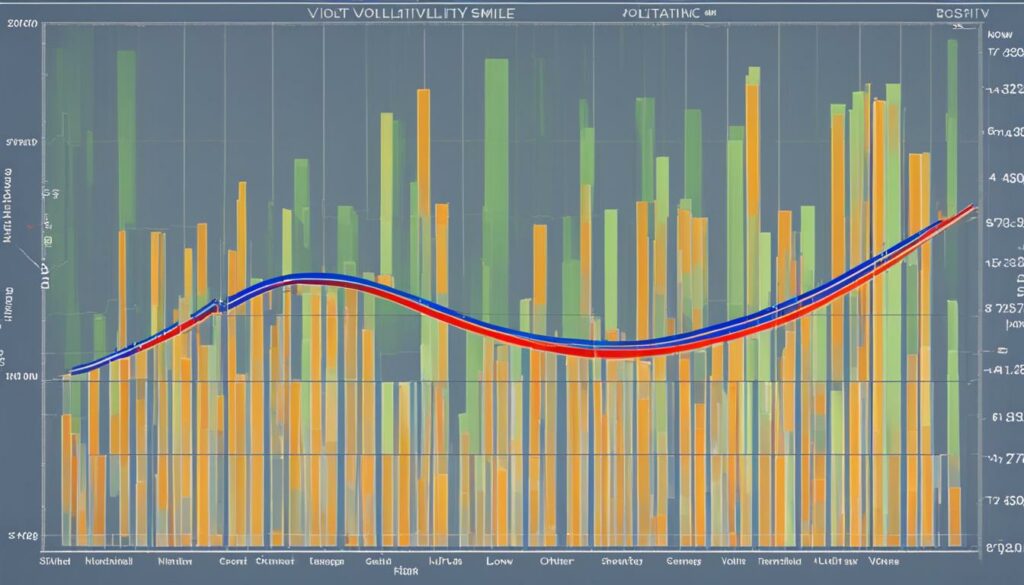
Table: Comparison of Volatility Smile, Skew, and Smirk
| Volatility Pattern | Definition | Commonly Observed in |
|---|---|---|
| Volatility Smile | Options that are furthest in-the-money or out-of-the-money have higher implied volatility compared to at-the-money options. | Near-term equity options, currency-related options |
| Volatility Skew | ITM or OTM options have higher implied volatility than ATM options. | Index options, long-term equity options |
| Volatility Smirk | Options at the same ATM level but with different expirations have different implied volatilities. | Options with shorter expirations |
Applying the Volatility Smile in Option Valuation
Option valuation is a complex process that requires careful consideration of various factors, including implied volatility and the shape of the volatility smile. Traders and investors use option pricing models, such as the Black-Scholes model, to estimate the fair value of an option. However, these models may need to be adjusted to account for the shape of the volatility smile and deviations from the assumptions of a flat implied volatility curve.
One way to apply the volatility smile in option valuation is by incorporating it into the inputs of option pricing models. Instead of assuming a constant implied volatility, traders can use the implied volatility corresponding to each strike price to generate more accurate valuations. By considering the market’s expectations of future price movements as reflected in the volatility smile, traders can better estimate the true value of an option.
Additionally, the volatility smile can also be used as a risk management tool. Traders can assess the risk-reward profile of different options by comparing their implied volatility levels to the volatility smile. Options with a higher implied volatility relative to the smile may be overpriced and present an opportunity for selling, while options with a lower implied volatility may be underpriced and present an opportunity for buying.
| Option Analysis | Key Insights |
|---|---|
| Volatility Smile | The volatility smile provides insights into market expectations of future price movements and risk. |
| Adjusting Option Pricing Models | Option pricing models should be adjusted to account for the shape of the volatility smile and deviations from a flat implied volatility curve. |
| Accurate Option Valuation | Incorporating the volatility smile into option pricing models can lead to more accurate valuations by considering market expectations. |
| Risk Management | The volatility smile can be used as a tool for assessing the risk-reward profile of different options. |
Overall, understanding and applying the volatility smile in option valuation is essential for traders and investors looking to make informed decisions in the options market. By considering the shape of the volatility smile and its implications for pricing and risk, traders can enhance their ability to assess option values and develop effective trading strategies.
Conclusion
In conclusion, the volatility smile is a significant tool for option traders and risk managers in the options market. It provides valuable insights into the market’s expectations of future price movements and risk, allowing traders to assess the value and risk of different options. By understanding the volatility smile, traders can make more informed decisions and potentially enhance their returns.
It is important to note that the volatility smile has its limitations and variations, such as volatility skew and smirk. Traders should consider these factors and not rely solely on the volatility smile for their trading decisions. Additionally, the volatility smile should be incorporated into option pricing models and trading strategies to accurately assess the fair value of options.
Implied volatility plays a crucial role in options trading, and the volatility smile provides a visual representation of the relationship between strike prices and implied volatility. By considering the shape of the volatility smile, traders can develop effective option trading strategies and manage their risk effectively in the dynamic options market.
FAQ
What is a volatility smile?
A volatility smile is a graph that shows the relationship between the strike price and implied volatility of options with the same underlying asset and expiration date. It indicates that options that are furthest in-the-money or out-of-the-money tend to have higher implied volatility.
Why is the volatility smile important?
The volatility smile provides insights into the market’s expectations of future price movements and risk. It helps traders assess the relative value and risk of different options and develop effective trading strategies.
How does implied volatility affect options pricing?
Implied volatility reflects the market’s expectation of future price volatility and is an important factor in options pricing. Options with higher implied volatility are generally more expensive, as they have a higher probability of larger price swings.
When did the volatility smile become prominent?
The volatility smile became prominent after the 1987 stock market crash. It taught traders that extreme events can occur, leading to significant price shifts and market skew.
How can traders use the volatility smile in option trading strategies?
The volatility smile can help traders assess the relative attractiveness of different options and create positions that align with their risk and return objectives. It is also crucial for evaluating the sensitivities of options to changes in factors such as delta, gamma, and vega.
What factors influence the shape of the volatility smile?
The shape of the volatility smile is influenced by factors such as demand and supply dynamics in the options market, overall market sentiment, expectations of potential price swings, and different strikes and expirations.
What are the limitations of the volatility smile?
The volatility smile may not accurately capture market dynamics, especially in the presence of extreme events. It is important to consider other factors such as supply and demand dynamics when making trading decisions and not rely solely on the volatility smile.
What is the difference between volatility smile and volatility skew/smirk?
A volatility skew refers to a situation where in-the-money or out-of-the-money options have higher implied volatility than at-the-money options. A volatility smirk represents a situation where the implied volatility is higher for options at the same at-the-money level but with different expirations.
How is the volatility smile applied in option valuation?
The volatility smile is incorporated into option pricing models to estimate the fair value of an option. Traders and investors use various option pricing models, such as the Black-Scholes model, and adjust them to account for the shape of the volatility smile.


