Wedge Chart Pattern Explained
Welcome to our comprehensive guide on the Wedge chart pattern. In this article, we will delve into the intricacies of this powerful chart pattern that can help traders make informed decisions in the market. Whether you’re new to chart patterns or an experienced trader, understanding the Wedge pattern is crucial for successful technical analysis and implementing effective trading strategies.
Key Takeaways:
- Wedge chart patterns consist of two converging trend lines and can indicate either a continuation or reversal pattern.
- Rising wedges typically signal a bearish reversal, while falling wedges suggest a bullish continuation.
- Identifying and understanding wedge patterns is essential for effective technical analysis and successful trading strategies.
- Traders can capitalize on wedge patterns by implementing specific trading strategies and managing risk.
- Wedge chart patterns can be applied to various markets, including forex and stocks.
Rising Wedge Pattern in Trading
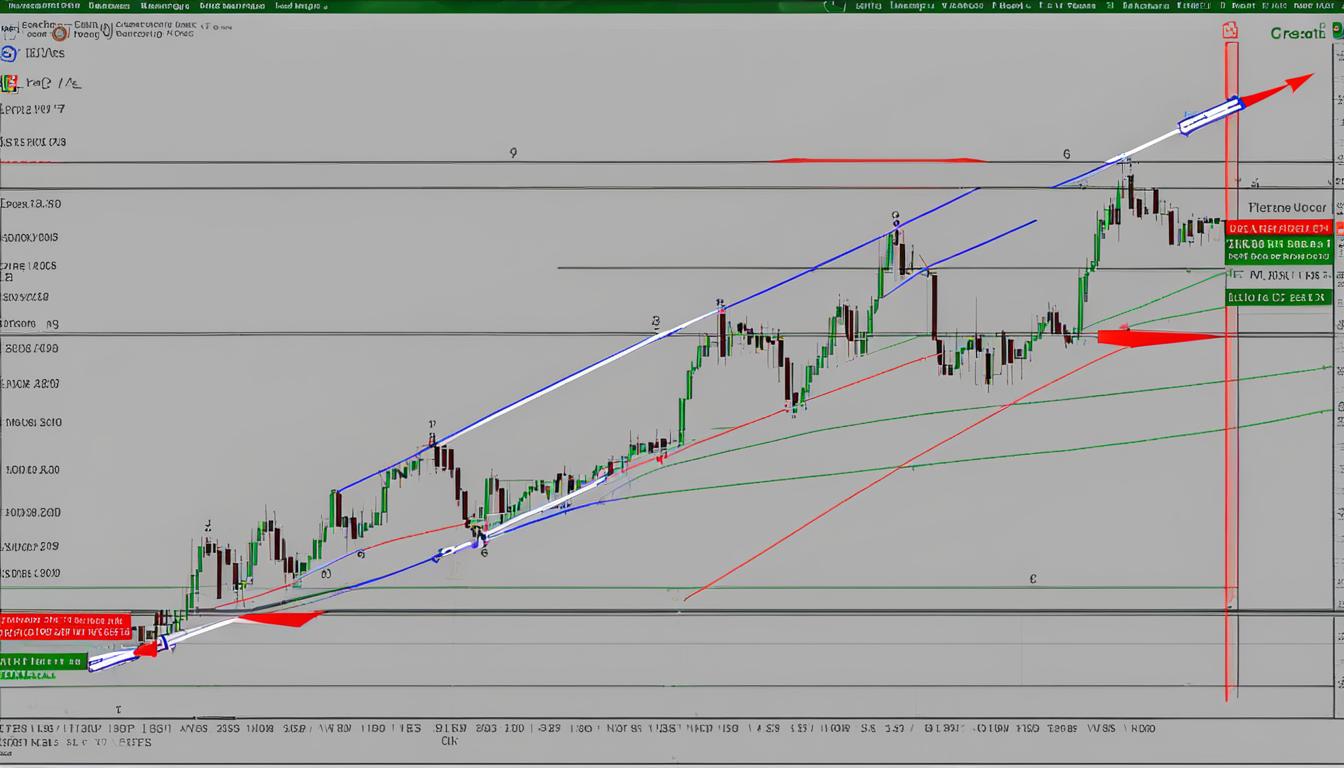
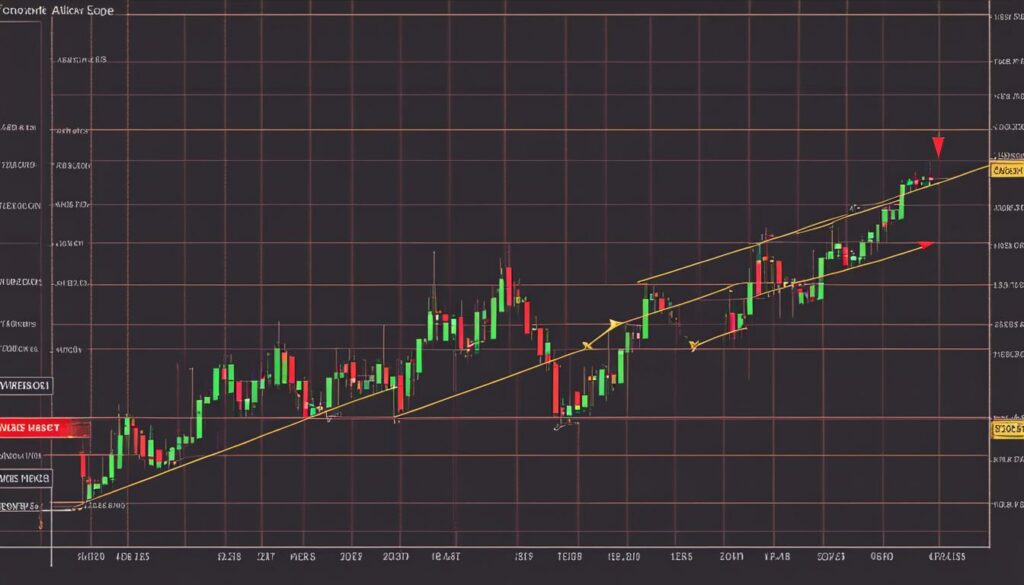
A rising wedge is a bearish chart pattern that forms at the end of an uptrend. It features upward sloping support and resistance lines, with higher lows forming faster than higher highs. When a rising wedge forms after an uptrend, it often signals a bearish reversal pattern.
Traders can take advantage of this pattern by placing entry orders to short the pair when the price breaks below the trend line. By understanding and trading the rising wedge pattern, traders can potentially profit from the subsequent downtrend.
It’s important to note that not all rising wedges result in a significant downtrend. Traders should always use risk management strategies and consider other technical analysis indicators before entering a trade based solely on the formation of a rising wedge pattern.
“The rising wedge pattern is a powerful tool in technical analysis, providing valuable insights into potential bearish reversals,” says our trading expert. “By identifying and understanding this pattern, traders can make informed trading decisions and potentially increase their profitability.”
To further illustrate the concept, consider the following table that showcases the characteristics of a rising wedge pattern:
| Characteristics | Description |
|---|---|
| Formation | Upward sloping support and resistance lines |
| Price Action | Higher lows forming faster than higher highs |
| Signal | Bearish reversal pattern |
| Action | Place entry orders to short the pair when price breaks below the trend line |
By carefully analyzing the rising wedge pattern and incorporating it into their trading strategies, traders can potentially improve their chances of successful trades in the forex and stock markets.
Falling Wedge Pattern in Trading
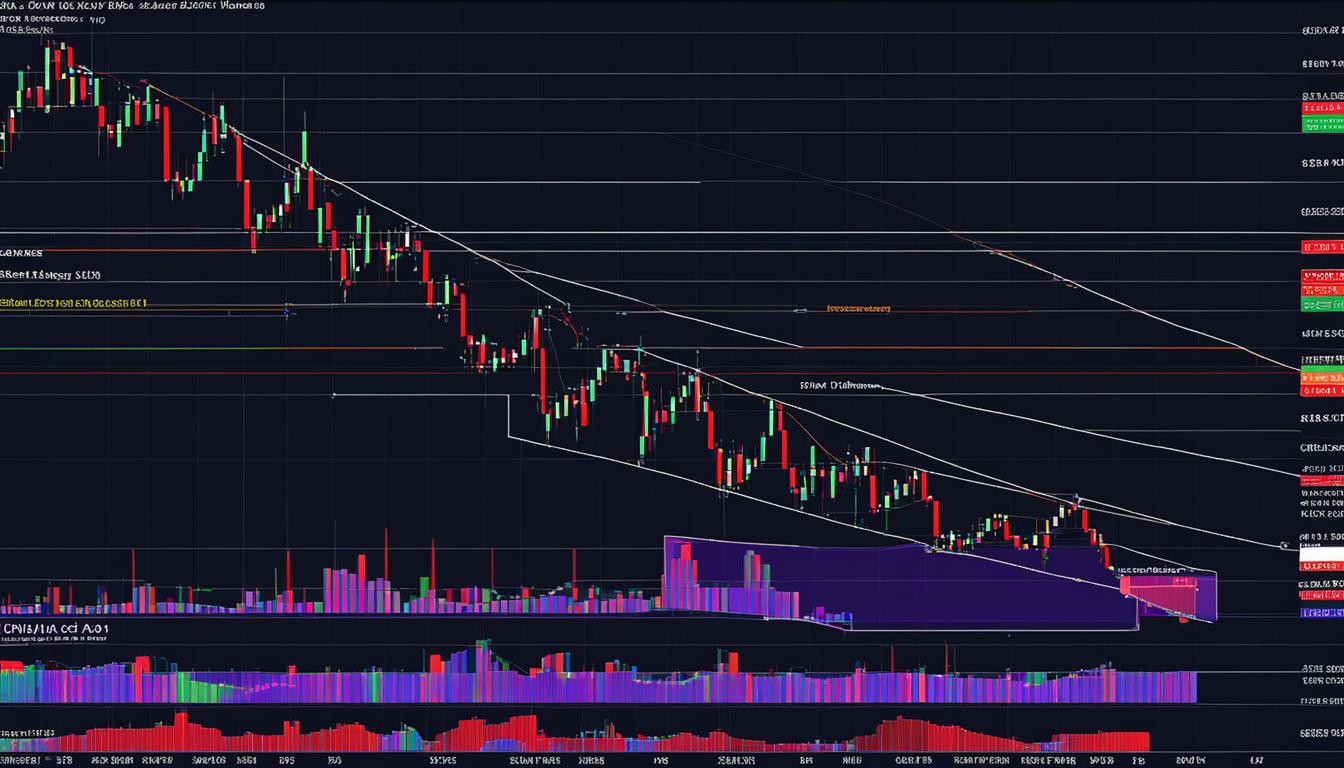
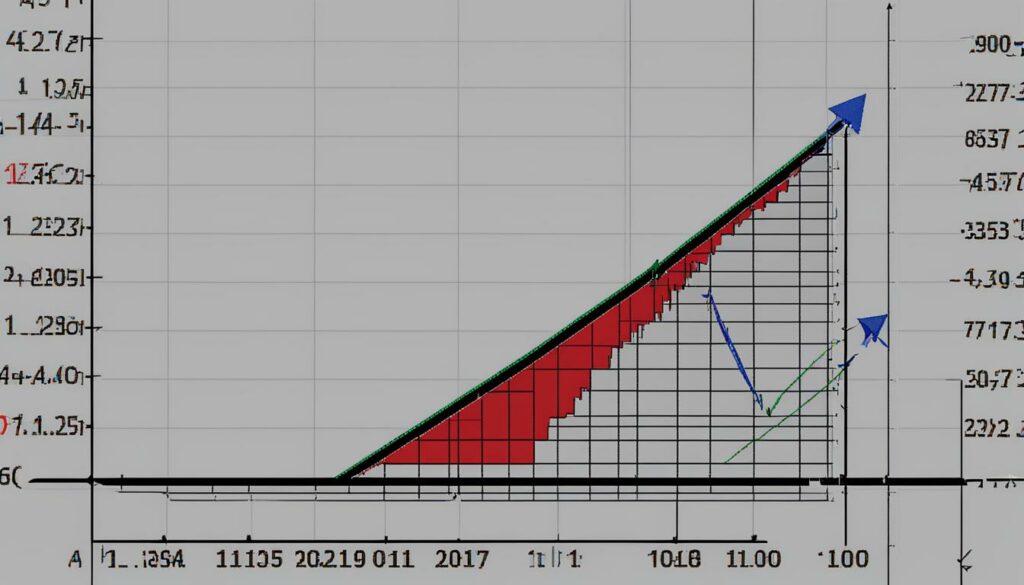
In trading, the falling wedge pattern is a bullish chart pattern that occurs at the end of a downtrend. It is characterized by downward sloping support and resistance lines, with lower highs forming faster than lower lows. The falling wedge pattern often signals a bullish reversal, indicating that the price may start to increase. By understanding and trading the falling wedge pattern, traders can potentially profit from the subsequent uptrend.
When a falling wedge pattern forms, traders can take advantage of it by placing entry orders to go long when the price breaks above the upper resistance trend line. This breakout signals a potential upward movement in price. Traders can also set a stop-loss order below the lower support line to manage risk. By following these strategies, traders can increase their chances of success when trading the falling wedge pattern.
Characteristics of the Falling Wedge Pattern
The falling wedge pattern has specific characteristics that traders should be aware of. First, the pattern has downward sloping support and resistance lines, indicating a narrowing price range. Second, lower highs form at a steeper rate than lower lows, creating the wedge shape. Third, the pattern occurs after a downtrend, suggesting a potential reversal in price direction. Traders can use technical analysis indicators and confirmation signals to validate the pattern and make accurate predictions.
| Characteristics | Description |
|---|---|
| Shape | Downward sloping support and resistance lines |
| Price Range | Narrowing range over time |
| Rate of Lower Highs | Faster than rate of Lower Lows |
| Trend | Occurs after a downtrend |
By recognizing and interpreting these characteristics, traders can effectively identify and trade the falling wedge pattern.
Trading Strategies for Wedge Chart Patterns
When it comes to trading wedge chart patterns, having a well-defined strategy is essential for success. Whether you’re trading bullish wedge patterns or bearish wedge patterns, following a systematic approach can help you capitalize on potential reversals and maximize your profits. Here, we outline some key strategies to consider:
- Identify the pattern: The first step is to recognize the wedge pattern on the chart. Look for converging trendlines, with the support line sloping upward for a rising wedge or downward for a falling wedge.
- Wait for confirmation: It’s crucial to wait for a breakout before entering a trade. A breakout occurs when the price breaks above the upper resistance trendline for a falling wedge or below the lower support trendline for a rising wedge.
- Determine an entry point: Once the breakout has occurred, identify a suitable entry point. This can be based on a variety of factors, such as a pullback to the trendline or a specific price level.
- Set a stop loss: To manage risk, set a stop loss order below the breakout level. This will help limit potential losses if the trade does not go as expected.
- Estimate a price target: Use technical analysis tools and indicators to estimate a price target for the trade. This can be based on previous support or resistance levels or other relevant factors.
- Manage risk: Implement proper risk management techniques, such as using appropriate position sizes and adjusting stop losses as the trade progresses.
- Develop an exit strategy: Plan your exit strategy in advance. This can involve taking partial profits at predetermined levels or trailing your stop loss to lock in profits as the trade moves in your favor.
By following these steps and incorporating technical analysis indicators into your trading strategy, you can enhance your trading skills and increase the likelihood of successful trades.

Characteristics and Signals of Wedge Chart Patterns
As we delve deeper into the world of wedge chart patterns, it’s important to understand their unique characteristics and the signals they provide. Whether you’re a seasoned trader or just starting out, recognizing these patterns can greatly enhance your technical analysis and trading strategies.
When it comes to wedge chart patterns, there are two main types: rising wedges and falling wedges. Rising wedges feature upward sloping support and resistance lines, while falling wedges have downward sloping lines. These patterns typically occur after a strong trend and narrow in range over time.
To confirm the validity of a wedge pattern, traders look for a breakout. For a rising wedge, this would be a breakout below the lower support trendline, while a falling wedge requires a breakout above the upper resistance trendline. This breakout serves as a signal that the price is likely to continue in the direction indicated by the wedge pattern.
Technical analysis indicators can be used to validate the pattern and make accurate predictions. By combining these indicators with the characteristics and signals of wedge chart patterns, traders can gain a better understanding of potential market reversals and make more informed trading decisions.
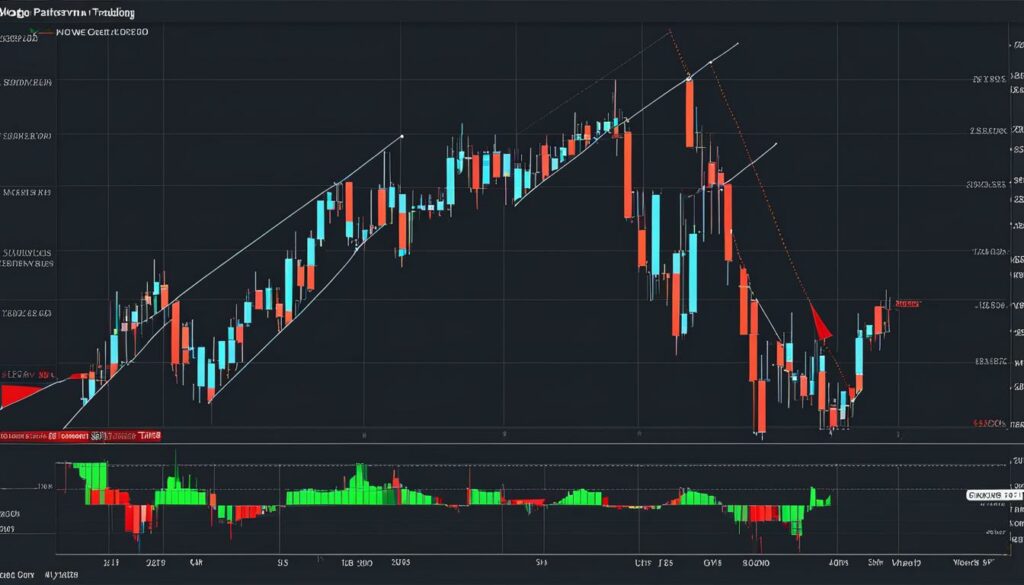
Table: Comparison of Rising and Falling Wedge Chart Patterns
| Rising Wedge | Falling Wedge | |
|---|---|---|
| Characteristics | Upward sloping support and resistance lines | Downward sloping support and resistance lines |
| Price Trend | Bearish reversal pattern | Bullish reversal pattern |
| Breakout Direction | Breakout below lower support trendline | Breakout above upper resistance trendline |
| Confirmation | Price breaks below lower support trendline | Price breaks above upper resistance trendline |
Understanding the characteristics and signals of wedge chart patterns is crucial for successful trading. By identifying these patterns and using technical analysis indicators, traders can gain an edge in the market and improve their trading strategies.
Benefits of Trading Wedge Chart Patterns
Trading wedge chart patterns offers several benefits for us as traders. These patterns provide clear signals of potential trend reversals, allowing us to enter trades with defined entry and exit points. Wedge chart patterns can be applied to various markets, including forex and stocks, making them versatile trading strategies that can be used across different asset classes.
One of the key benefits of trading wedge chart patterns is their ability to provide us with well-defined entry and exit points. When a wedge pattern forms, it indicates that the price is consolidating within a narrowing range, creating an opportunity for a potential breakout. By waiting for a breakout confirmation, we can enter a trade with a higher degree of confidence, knowing that the price is likely to continue in the direction indicated by the wedge pattern.
Another advantage of trading wedge chart patterns is their versatility. These patterns can be applied to various markets, such as forex and stocks, allowing us to utilize them in different trading strategies. Whether we are trading currency pairs or individual stocks, wedge patterns can provide valuable insights into potential reversals, enabling us to make informed trading decisions.
| Benefits of Trading Wedge Chart Patterns |
|---|
| Clear signals of potential reversals |
| Defined entry and exit points |
| Versatility across different markets |
In summary, trading wedge chart patterns can offer us several advantages, including clear signals of potential reversals, defined entry and exit points, and versatility across different markets. By understanding and utilizing these patterns, we can enhance our trading strategies and increase our chances of success in the market.
Trading Timeframes for Wedge Chart Patterns
| Timeframe | Description |
|---|---|
| Intraday | Wedge chart patterns can form within a single trading day, providing short-term trading opportunities. |
| Short-term | Wedges that develop over a few days to a few weeks are considered short-term patterns. Traders can capitalize on these patterns for quick profits. |
| Medium-term | Medium-term wedge patterns typically form over several weeks to a few months. These patterns offer more substantial trading opportunities and may indicate significant trend reversals. |
| Long-term | The strongest wedge patterns often develop over a three- to six-month period and can signify major trend changes. Traders who can identify and trade these patterns with patience may enjoy substantial profits. |
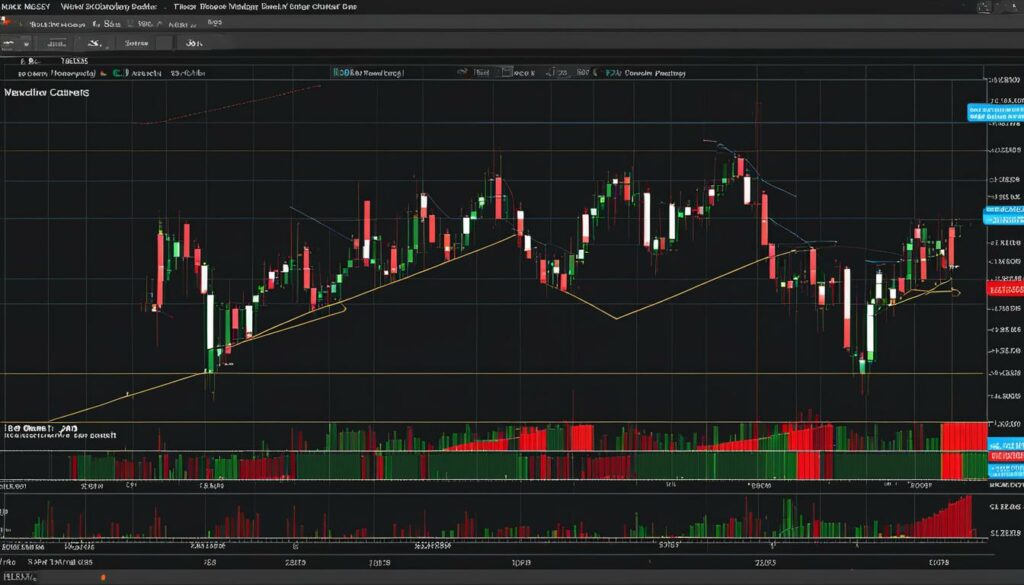
If you want to identify wedge chart patterns, it’s essential to consider the timeframe in which they occur. Wedges can form within a single trading day or develop over several months, each offering its own unique trading opportunities. Intraday wedges are suitable for short-term traders looking for quick profits, while medium-term and long-term wedges may indicate significant trend reversals. By understanding and identifying wedge patterns across various timeframes, traders can tailor their strategies to suit their preferred trading style and time horizon.
When trading wedge chart patterns, it’s important to remember that the timeframe can impact the reliability and strength of the pattern. Shorter-term wedges may be more prone to false breakouts and price noise, while longer-term wedges tend to offer more reliable signals and significant price movements. Traders should analyze the overall market context, consider additional technical indicators for confirmation, and adapt their risk management strategies accordingly when trading different timeframes. By aligning their trading approach with the timeframe of the wedge pattern, traders can increase their chances of success and improve their trading outcomes.

It’s essential to stay attentive to the timeframe in which wedge chart patterns form. Whether you are a short-term day trader or a long-term investor, understanding and identifying these patterns within your preferred trading timeframe can help you make better-informed trading decisions. By combining technical analysis with an awareness of the timeframe, you can enhance your wedge pattern trading strategies and maximize your profits in the market. Remember to consider the available historical data and use appropriate technical tools to accurately identify wedge patterns that align with your trading goals.
How to Identify Wedge Chart Patterns
Identifying wedge chart patterns is a crucial skill for traders who want to take advantage of potential trend reversals in the market. By understanding the key characteristics of wedges and using technical analysis, traders can make informed trading decisions and improve their overall trading strategy.
To identify a wedge pattern, traders should look for converging trendlines with either upward or downward slopes. A rising wedge pattern is characterized by upward sloping support and resistance lines, while a falling wedge pattern features downward sloping lines. In both cases, the highs and lows within the wedge should be moving in the same direction as the trading range narrows.
Confirmation of a wedge pattern occurs when the price breaks below the lower support trendline for a rising wedge or above the upper resistance trendline for a falling wedge. Traders can use trading volume as confirmation for a breakout and should wait for a convincing breakout before entering a trade. By accurately identifying wedge patterns, traders can enhance their trading strategies and increase their chances of success.
Benefits of Accurate Wedge Pattern Identification:
- Clear signals of potential trend reversals
- Defined entry and exit points for trades
- Applicable to various markets, including forex and stocks
- Improved trading strategies and profitability
“Accurately identifying wedge patterns can provide valuable insights into potential market reversals and help traders make informed trading decisions.”
By mastering the art of identifying wedge chart patterns, traders can gain a competitive edge in the market and improve their overall trading performance. With the right technical analysis skills and a strategic approach, traders can maximize their profitability and make the most of trading opportunities presented by wedge patterns.
Table: Examples of Wedge Chart Patterns
| Wedge Pattern | Description | Signal |
|---|---|---|
| Rising Wedge | Upward sloping support and resistance lines | Bearish reversal pattern |
| Falling Wedge | Downward sloping support and resistance lines | Bullish reversal pattern |

Conclusion
Accurately identifying wedge chart patterns is essential for traders looking to enhance their technical analysis skills and improve their trading strategies. By understanding the key characteristics of wedges and using technical analysis indicators, traders can make informed trading decisions and potentially increase their profitability. By mastering the art of identifying wedge patterns, traders can gain a competitive edge in the market and take advantage of potential trend reversals.
Tips for Trading Wedge Chart Patterns
Trading wedge chart patterns can be a lucrative strategy when approached with the right techniques and risk management. Here are some tips to help you navigate the market and make the most of wedge chart patterns:
- Consider the overall market context: Before trading wedge patterns, analyze the broader market trends and factors that could impact price movements. This will help you make more informed trading decisions.
- Use additional technical indicators: While wedge patterns can provide valuable insights, it’s essential to use other technical indicators such as moving averages, oscillators, or volume indicators to validate the pattern and enhance your trading strategy.
- Employ sound risk management strategies: Set appropriate position sizes based on your risk tolerance, use trailing stop losses to protect profits, and stay updated with market news and events that could influence price action.
“Success in trading wedge patterns lies in understanding the dynamics of the market and making calculated decisions. By combining technical analysis with risk management, traders can mitigate potential losses and improve their overall profitability.”
Monitoring other technical analysis indicators in conjunction with wedge patterns can provide valuable confirmation signals. These may include trendlines, chart patterns, or momentum oscillators. By leveraging these indicators, traders can further validate the reliability of a wedge pattern and increase their chances of a successful trade.
Summary:
Trading wedge chart patterns requires a comprehensive approach that incorporates technical analysis skills, risk management, and market awareness. By considering the overall market context, using additional technical indicators, and employing sound risk management strategies, traders can enhance their trading skills and improve their profitability when trading wedge chart patterns.
Examples and Case Studies of Wedge Chart Patterns
Real-world examples and case studies provide valuable insights into the effectiveness of wedge chart patterns. By analyzing historical charts and studying previous wedge patterns, traders can learn from successful trades and identify key factors that contributed to profitable outcomes.
One example of a rising wedge pattern occurred in Company XYZ’s stock chart. From January to March, the stock was in an uptrend, with higher highs and higher lows. However, as the price continued to rise, the range between the support and resistance lines narrowed, forming a rising wedge pattern. Traders who recognized this pattern had the opportunity to place short entry orders below the support line, anticipating a bearish reversal. When the price broke below the support line, a downtrend followed, allowing traders to profit from the decline in price.
Another example is a falling wedge pattern that occurred in the EUR/USD forex pair. After a prolonged downtrend, the price started to consolidate between downward sloping support and resistance lines. This narrowing range formed a falling wedge pattern. Traders who identified this pattern had the opportunity to place long entry orders above the resistance line, anticipating a bullish reversal. When the price broke above the resistance line, an uptrend ensued, providing traders with profitable trading opportunities.
| Example | Pattern | Entry Point | Outcome |
|---|---|---|---|
| Company XYZ | Rising Wedge | Short entry below support line | Downtrend, profitable trade |
| EUR/USD | Falling Wedge | Long entry above resistance line | Uptrend, profitable trade |
These examples highlight the potential reversals and trading opportunities that rising and falling wedge patterns can present. By examining historical data and studying these case studies, traders can gain a deeper understanding of how to effectively trade wedge chart patterns and improve their trading strategies.
Conclusion
In conclusion, wedge chart patterns are valuable tools in technical analysis that can provide insights into potential trend reversals in the market. By understanding and trading these patterns, traders can develop profitable trading strategies. The rising wedge pattern indicates a bearish reversal, while the falling wedge pattern suggests a bullish continuation.
Implementing the strategies outlined in this article, such as identifying the pattern, waiting for confirmation, and setting entry and exit points, can enhance trading skills and increase profitability. It is essential to consider the overall market context, use technical indicators for validation, and practice sound risk management strategies.
By maximizing the benefits of wedge chart patterns, traders can navigate the market with confidence and make informed trading decisions. Remember to stay informed, practice, and refine your trading strategies to effectively utilize wedge chart patterns for successful trading.
FAQ
What is a wedge chart pattern?
In a wedge chart pattern, two trend lines converge, indicating a decreasing magnitude of price movement. Wedges can serve as either continuation or reversal patterns.
What is a rising wedge pattern?
A rising wedge is a bearish chart pattern that forms at the end of an uptrend. It features upward sloping support and resistance lines, with higher lows forming faster than higher highs.
What is a falling wedge pattern?
A falling wedge is a bullish chart pattern that forms at the end of a downtrend. It features downward sloping support and resistance lines, with lower highs forming faster than lower lows.
How can I profit from a rising wedge pattern?
Traders can take advantage of a rising wedge pattern by placing entry orders to short the pair when the price breaks below the trend line, potentially profiting from the subsequent downtrend.
How can I profit from a falling wedge pattern?
Traders can take advantage of a falling wedge pattern by placing entry orders to go long when the price breaks above the trend line, potentially profiting from the subsequent uptrend.
What strategies can I use to trade wedge chart patterns?
Strategies for trading wedge chart patterns include identifying the pattern, waiting for confirmation, determining an entry point, setting a stop loss, estimating a price target, managing risk, and developing an exit strategy.
How can I identify wedge chart patterns?
Traders should look for converging trendlines, with the support and resistance lines either sloping upward for a rising wedge or downward for a falling wedge. Both the highs and lows within the wedge should be moving in the same direction as the trading range narrows.
What are the benefits of trading wedge chart patterns?
Wedge chart patterns provide clear signals of potential reversals, allowing traders to enter trades with defined entry and exit points. They can be applied to various markets, making them versatile trading strategies.
What timeframes do wedge chart patterns occur on?
Wedge chart patterns can occur over different timeframes, ranging from intraday to several months. The strongest patterns typically develop over a three- to six-month period.
How can I trade wedge chart patterns successfully?
Successful trading of wedge chart patterns requires a combination of technical analysis skills and strategic decision-making. Traders should consider the overall market context, use additional technical indicators for validation, and employ sound risk management strategies.
Are there any real-world examples of successful wedge chart pattern trades?
Yes, analyzing historical charts and studying previous wedge patterns can provide valuable insights. By examining these examples, traders can gain a deeper understanding of how to trade wedge chart patterns effectively.


